Figure 5.
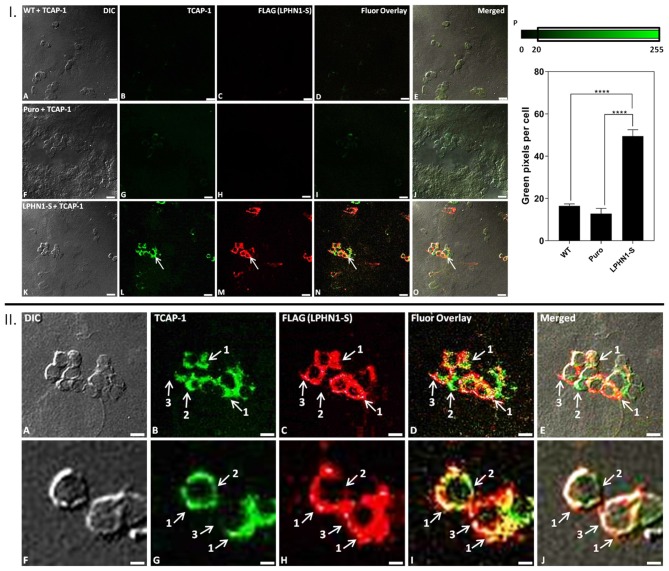
FITC-K37-mTCAP-1 co-localizes with LPHN1 expression. I: (A–E) HEK-WT cells treated with FITC-K37-mTCAP-1. (F–J) HEK-Puro cells treated with FITC-K37-mTCAP-1. (K–O) HEK-LPHN1-S cells treated with FITC-K37-mTCAP-1. Arrows indicate regions of FITC-K37-mTCAP-1 and LPHN1-S co-localization. (A,F,K) DIC. (B,G,L) FITC-K37-mTCAP-1. (C,H,M) FLAG (LPHN1-S) expression. (D,I,N) FITC-K37-mTCAP-1 and FLAG (LPHN1-S) fluorescence channel overlay images. (E,J,O) Merged image of all channels. A low level of green fluorescence is seen in HEK-WT and HEK-Puro cells, indicating some uptake of FITC-K37-mTCAP-1. However, HEK-LPHN1-S cells show a much brighter green fluorescence signal, indicating a higher uptake of FITC-K37-mTCAP-1. Scale bar in all images is 25 μm. (P) Average number of green pixels per cell with an intensity ranging from 20 to 255 in HEK-WT, HEK-Puro, and HEK-LPHN1-S cells treated with FITC-K37-mTCAP-1. Pixel intensity range is indicated above graph. HEK-LPHN1-S cells have a significantly higher number of green pixels with intensities of 20–255 per cell, indicating a higher degree of FITC-K37-mTCAP-1 uptake compared to HEK-WT and HEK-Puro cells. No significant differences between HEK-WT and HEK-Puro cells were observed. (Mean ± SEM; n = 5; ****p < 0.0001; one-way ANOVA) II: (A–J) Confocal images of HEK-LPHN1-S cells. (A,F) DIC. (B,G) FITC-K37-mTCAP-1. (C,H) LPHN1-S. (D,I) Merged images of B–C and G–H, respectively. (E,J) Merged images of A–C and F–H, respectively. Scale bar in A–E is 20 μm and in F–J is 6 μm. Regions of FITC-K37-mTCAP-1 and LPHN1-S co-localization on the cell membrane were predominant (arrows labeled 1); however, areas of only FITC-K37-mTCAP-1 localization (arrows labeled 2) or of only LPHN1-S localization (arrows labeled 3) were also seen present in HEK293-LPHN1-S cells.

