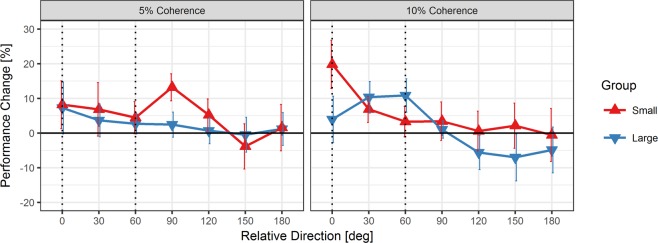
Figure 1.
Mean performance change in motion discrimination (with SEMs) at 5% and 10% motion coherence in the “small” group and the “large” group. Performance change was calculated by subtracting pretest from posttest performance for each tested motion direction and then collapsing data across equivalent motion directions clockwise and counterclockwise relative to the target-paired motion direction (0°). Dotted vertical lines indicate motion directions that were paired with targets (0°, both groups) or distractors (60°, “large” group) in the RSVP task during the training sessions.

