Fig. 1.
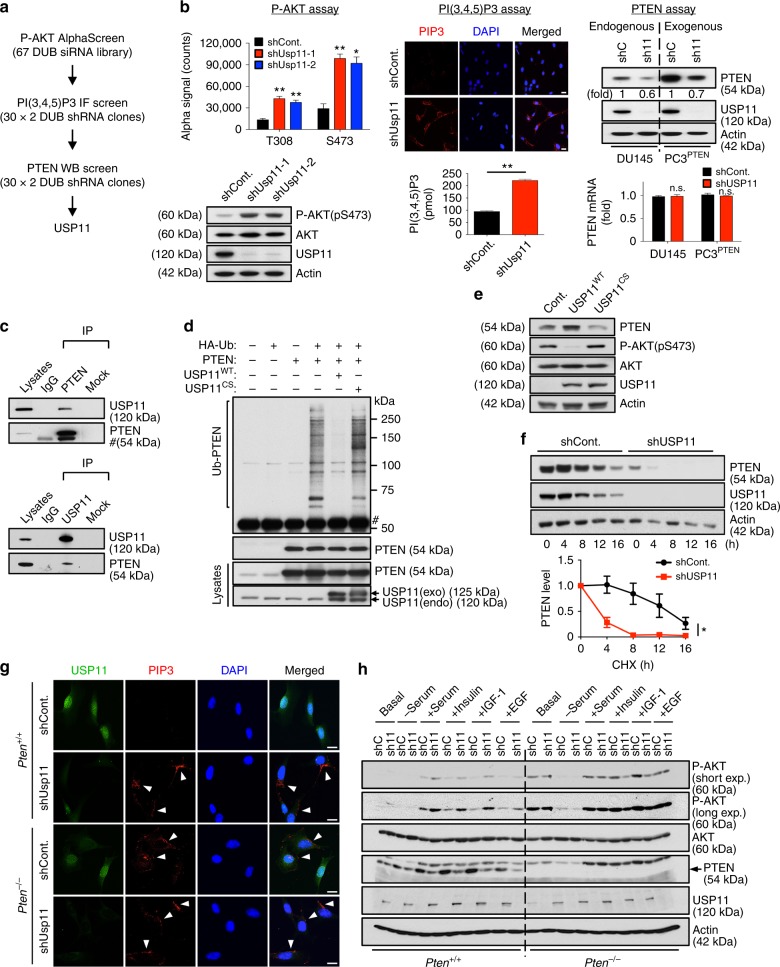
USP11 reduces PIP3 levels by deubiquitinating and stabilizing PTEN. a The screen scheme for the DUB library. b Validation of an RNAi screen in (a). MEFs expressing two independent Usp11 shRNAs were subjected to AlphaScreen assays (top, left) and immunoblotting (IB) (bottom, left). The levels of PIP3 in MEFs expressing Usp11 shRNA were evaluated using an IF (top, middle) and PIP3 Mass ELISA assays (bottom, middle). Lysates and total RNAs from PTEN-proficient DU145 cells and PTEN-deficient PC3 cells complemented with PTEN expressing USP11 shRNAs were subjected to IB (top, right) and RT-qPCR (bottom, right). Scale bars, 10μm. n = 3. Error bars represent ± SEM. p Value was determined by Student’s t test (n.s., non-significant; *p < 0.05; **p < 0.01). c Lysates from DU145 cells were immunoprecipitated (IP) without (Mock) or with anti-PTEN (top) or anti-USP11 (bottom) antibody and subjected to IB. # indicates heavy chain of IgG. d Lysates from 293T cells transfected as indicated and treated with 10 μM MG132 for 4 h were IP with anti-Myc–PTEN, and the resulting immunoprecipitates were subjected to IB. # indicates the heavy chain of IgG. HA-Ub, HA-tagged ubiquitin. e Lysates from DU145 cells overexpressing wild-type (WT) or catalytically inactive C318S (CS) mutant of USP11 were subjected to IB. f Lysates from NB4 cells expressing USP11 shRNA and treated with cycloheximide (CHX, 100 μg ml−1) for the indicated times were subjected to IB (top). PTEN protein levels were quantified by normalizing to the intensity of the actin band (bottom). n = 3. Error bars represent ± SEM. p Value was determined by ANOVA (*p < 0.05). g IF analysis of PIP3 in Pten+/+ and Pten-/- MEFs expressing Usp11 shRNAs starved for 8 h and stimulated with 100 nM insulin for 5 min. Arrowheads indicate the accumulation of PIP3 at the leading edges of membrane projections. Scale bars, 10μm. h Lysates from Pten+/+ and Pten-/- MEFs expressing Usp11 shRNAs, starved for 8 h and stimulated with serum for 10 min or 100 nM insulin, 100 ng ml−1 IGF-1, or 25 ng ml−1 EGF for 5 min, were subjected to IB. MEFs, mouse embryonic fibroblasts; RT-qPCR, real-time quantitative reverse transcription PCR

