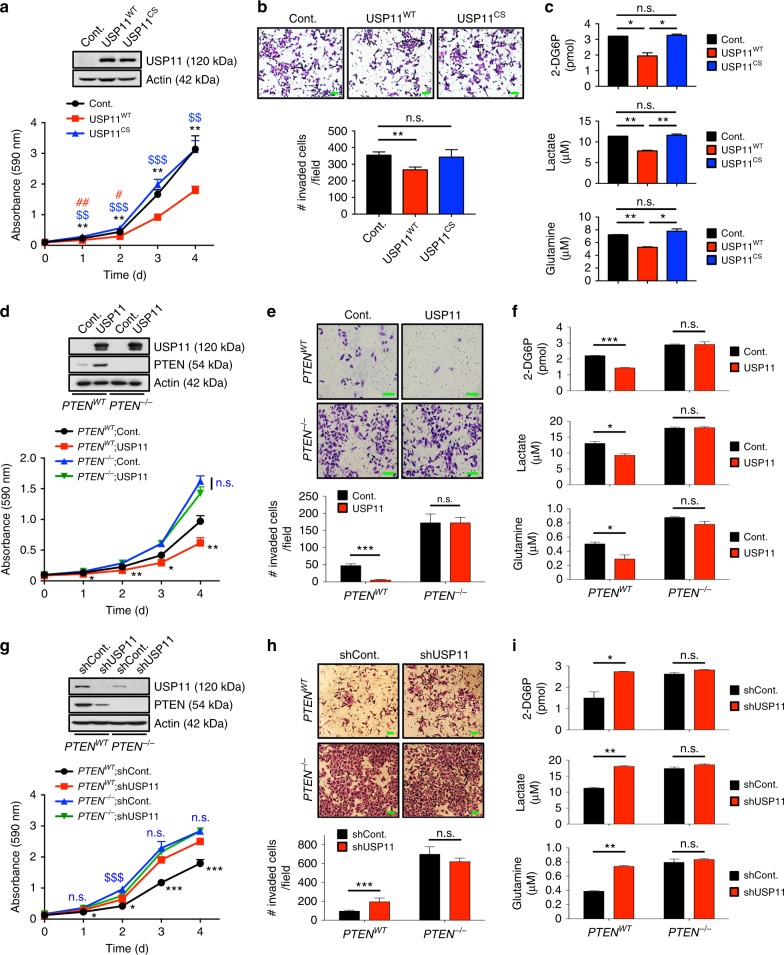
Fig. 4.
USP11 suppresses cancer cell biology in a PTEN-dependent manner. a Growth curves of HAP1 cells knocked out (KO) for USP11 using CRISPR/Cas9 technology expressing wild-type (WT) or catalytically inactive C318S (CS) mutant of USP11. n = 3. **p < 0.01, ***p < 0.001, Cont. vs. USP11WT; $$p < 0.01, $$$p < 0.001, USP11WT vs. USP11CS; #p < 0.05, ##p < 0.01, Cont. vs. USP11CS. b Cell-invasion assays of HAP1 cells KO for USP11 expressing WT or CS mutant of USP11 in the presence of mitomycin C (5 μg ml−1) (top). The number of invaded cells per field was quantified (bottom). n = 3. c The rates of glucose uptake, lactate production, and glutamine consumption of HAP1 cells KO for USP11 expressing WT or CS mutant of USP11 were measured and normalized to cell number. n = 3. d Growth curves of PC3 PTENWT and PC3 PTEN-/- cells expressing USP11. n = 3. *p < 0.05, **p < 0.01, PTENWT; Cont. vs. PTENWT; USP11; n.s., non-significant, PTEN-/-;Cont. vs. PTEN-/-;USP11. e Cell-invasion assays of PC3 PTENWT and PC3 PTEN-/- cells ectopically expressing USP11 in the presence of mitomycin C (5 μg ml−1) (top). The number of invaded cells per field was quantified (bottom). n = 3. f The rates of glucose uptake, lactate production, and glutamine consumption of PC3 PTENWT and PC3 PTEN-/- cells ectopically expressing USP11 were measured and normalized to cell number. n = 3. g Growth curves of PC3 PTENWT and PC3 PTEN-/- cells expressing USP11 shRNA. n = 3. *p < 0.05, ***p < 0.001, PTENWT;shCont. vs. PTENWT;shUSP11; n.s., non-significant, $$$p < 0.001, PTEN-/-;shCont. vs. PTEN-/-;shUSP11. h Cell-invasion assays of PC3 PTENWT and PC3 PTEN-/- cells expressing USP11 shRNA in the presence of mitomycin C (5 μg ml−1) (top). The number of invaded cells per field was quantified (bottom). n = 3. i The rates of glucose uptake, lactate production, and glutamine consumption of PC3 PTENWT and PC3 PTEN-/- cells expressing USP11 shRNA were measured and normalized to cell number. n = 3. Scale bars, 100μm. Error bars represent ± SEM. p Value was determined by Student’s t test (n.s., non-significant; *p < 0.05, **p < 0.01, ***p < 0.001)

