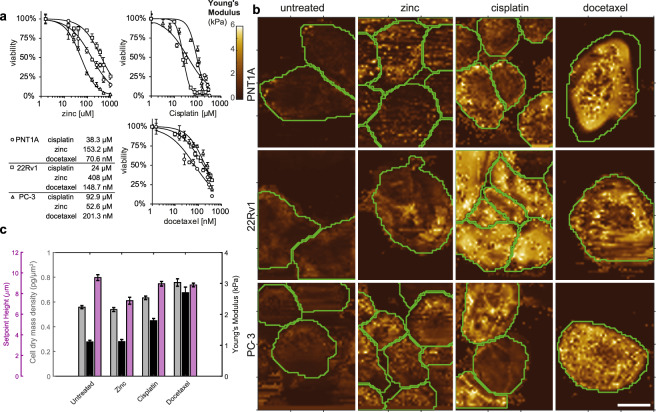
Figure 2.
Changes in biomechanical features; effect of treatment. (a) MTT test and respective IC50 concentration values. For detailed statistics see Supplementary Table S1. (b) Representative Young’s moduli maps of cell lines treated with zinc(II), docetaxel, and cisplatin. (c) Young’s moduli (cell stiffness), Setpoint Height, and cell dry mass density changes after zinc(II), docetaxel and cisplatin treatment. All tested cell lines (PNT1A, 22Rv1 and PC-3) assessed together. Error bars denote standard errors.

