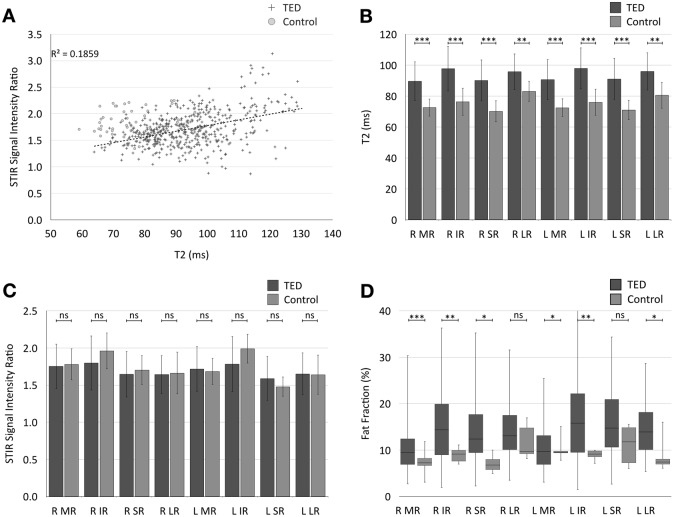
Fig. 2.
a Scatter plot showing a positive correlation between T2-relaxation times and STIR SIR in extra-ocular muscles in TED patients and healthy controls (r = 0.42 in TED patients). However, the groups are poorly separated across the SIR axis and better separated by T2-relaxation time. b Comparison of mean( ±SD) T2-relaxation times for individual extra-ocular muscles across the TED and control groups. T2-relaxation time is higher in the TED patients for each extra-ocular muscle. c Comparison of mean( ±SD) SIR for individual extra-ocular muscles across the TED and control groups. There was no statistically significant difference in mean SIR of any of the measured extra-ocular muscles between the two groups. d Boxplot showing median and range of fat fractions for each extra-ocular muscle compared between TED and control groups. There were significant differences detected in some of the extra-ocular muscles. Mean FF for all muscles as a group was significantly different between TED and control groups (p < 0.001). (R = right, L = left, MR = medial Rectus, IR = inferior rectus, SR = superior rectus, LR = lateral rectus. For p values: ***p < 0.001, **p < 0.01, *p < 0.05, ns non-significant.)

