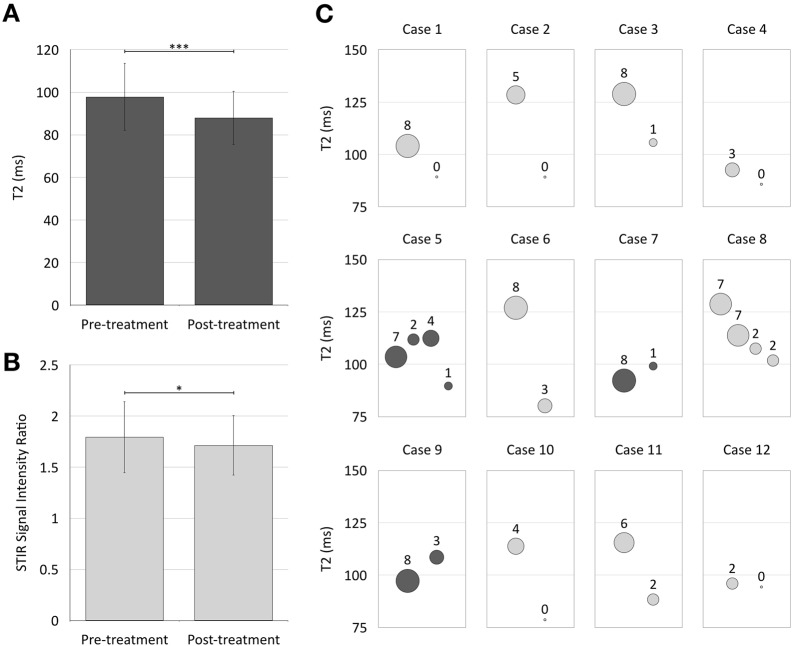
Fig. 3.
The mean T2-relaxation time (a) and SIR (b) in extra-ocular muscles of pre-treatment baseline examinations was higher than on post-treatment examinations (error bars–standard deviation; a ***p < 0.001; b *p = 0.04). c shows bubble plots of 12 individual cases with pre- and post-treatment examinations. Serial examinations are represented on the x-axis in arbitrary units of time. Maximal T2-relaxation times are plotted in the y-axis with CAS represented by the area of the bubbles (annotated for each data point). In most cases, T2-relaxation time for the worst affected muscle correlated with CAS, with both reducing following treatment. However, in cases 5, 7 and 9 (highlighted by darker shade), there is initially an increase in T2-relaxation time despite a decrease in recorded CAS. In case 8, there is initially a decrease in T2-relaxation time before a decrease in CAS is detected (see text for further discussion)

