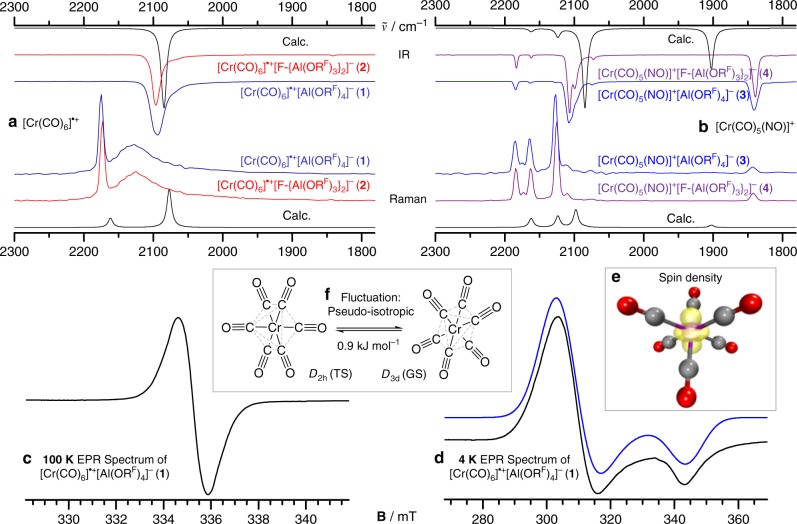
Fig. 2.
Block figure showing essential IR, Raman, and EPR spectra of complexes 1–4. a, b Stacked IR and Raman spectra of compounds 1 (dark blue), 2 (red), 3 (blue), 4 (purple), and the respective simulated calculated spectra (black, BP86-D3BJ/def2-TZVPP) of the cations in the CO/NO stretching range between 1800 and 2300 cm−1; For the full spectra, including an assignment of all bands see Supplementary Figures 42–49 and Supplementary Tables 2, 3. c EPR spectrum of 1 at X-Band (9.4002 GHz) in a frozen solution of a 1:1 (v:v) mixture of oDFB and toluene at 100 K. d Experimental (black) and simulated (blue) EPR spectrum of 1 at X-Band (9.37821 GHz) in a frozen solution of oDFB at 4 K in agreement with the D3d ground state. e Calculated spin density of D3d-[Cr(CO)6]•+ at the SA-CASSCF/cc-pVTZ level of theory. Isovalue at 0.02 a.u. f Equilibration path that transforms the two equivalent D3d ground states (GS) at 100 K over a low-lying D2h transition state (TS), yielding a coalescent signal in the 100 K EPR spectrum

