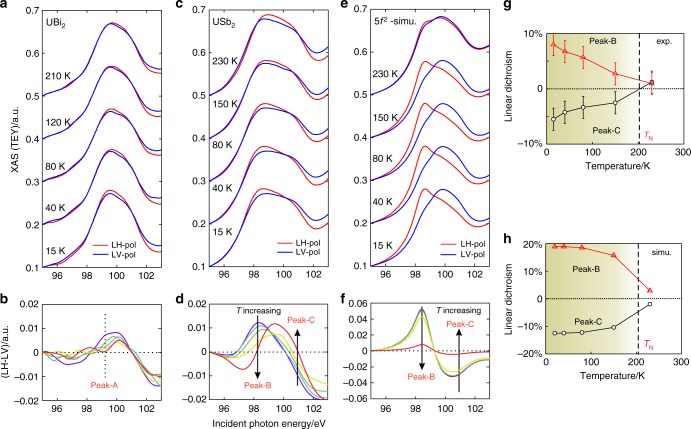
Fig. 3.
Temperature dependence of occupied f-electron symmetries. a The R1 XAS spectrum of UBi2 is shown for linear horizontal (LH) and vertical (LV) polarizations. b The dichroic difference (LH-LV) is shown with temperature distinguished by a rainbow color order (15K (purple), 40K (blue), 80K (green), 120K (yellow), and 210K (red)). c, d Analogous spectra are shown for USb2. Arrows in d show the monotonic trend direction on the peak-B and peak-C resonances as temperature increases. e, f Simulations for 5f2 with mean-field magnetic interactions. g A summary of the linear dichroic difference on the primary XAS resonances of USb2, as a percentage of total XAS intensity at the indicated resonance energy (hυ = 98.2 eV for peak-B, and hυ = 100.8 eV for peak-C). Error bars represent a rough upper bound on the error introduced by curve normalization. h The linear dichroic difference trends from the mean field model. Source data are provided as a Source Data file. Shading in g, h indicates the onset of a magnetic ordered moment

