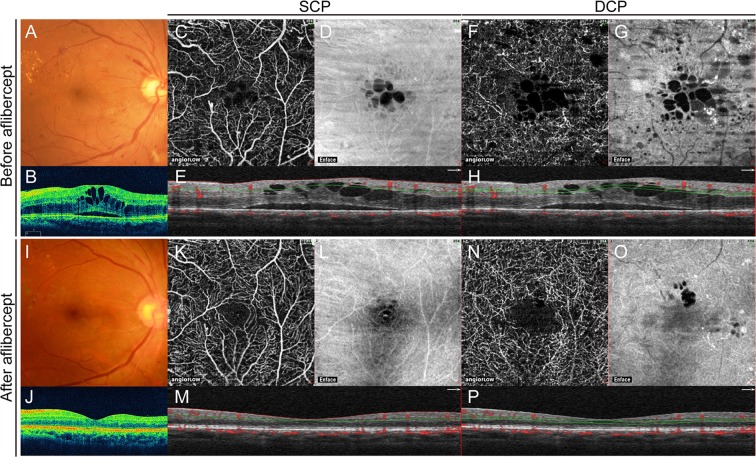
Figure 1.
Retinal images obtained from a 43-year-old woman before and after intravitreal aflibercept therapy for diabetic macular edema (DME). (A) Fundus photograph obtained before treatment. Visual acuity was 20/40. (B) Horizontally oriented spectral-domain optical coherence tomography (SD-OCT) images before treatment. Macular edema involving the fovea is apparent and central retinal thickness (CRT) is 628 µm. (C) Optical coherence tomography angiography (OCTA) images of the superficial capillary plexus (SCP) obtained before treatment. (D) The enface image. (E) The corresponding OCT cross-sectional image through the fovea is shown directly below. The retinal vascular area is 3.82 mm2. (F) OCTA images of the deep DCP obtained before treatment. (G) The enface image. (H) The corresponding OCT cross-sectional image through the fovea is shown directly below. The retinal vascular area is 4.06 mm2. (I) Fundus photograph obtained 12 months after treatment. The patient received four intravitreal aflibercept injections. Visual acuity was 20/22. (J) Horizontally oriented spectral-domain optical coherence tomography (SD-OCT) images after treatment. Macular edema is resolved, and CRT is 276 µm. (K) OCTA images of the SCP obtained after treatment. The retinal vascular area is 4.30 mm2. (L) The enface image. (M) The corresponding OCT cross-sectional image. (F) OCTA images of the DCP obtained after treatment. The retinal vascular area is 4.39 mm2. (G) The enface image. (H) The corresponding OCT cross-sectional image. The patient shows a relatively preserved vascular area with favorable post-treatment visual acuity after intravitreal aflibercept treatment. SCP, superficial capillary plexus; DCP, deep capillary plexus.

