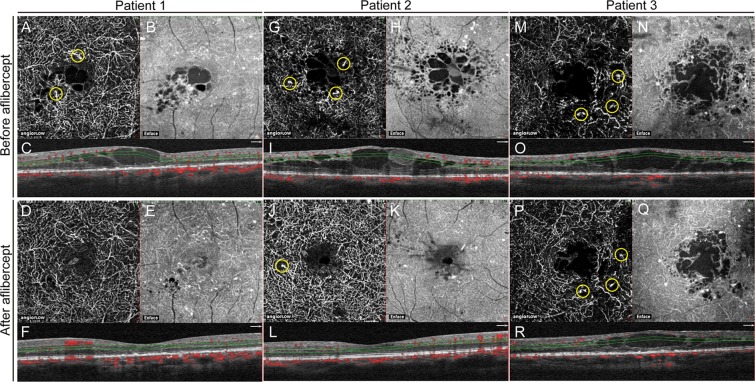
Figure 3.
Representative images of the deep capillary plexus (DCP) obtained from a 57-year-old man (patient 1; resolved diabetic macular edema), a 48-year-old man (patient 2; resolved diabetic macular edema), and a 55-year-old man (patient 3; persistent diabetic macular edema). (A) Optical coherence tomography angiography (OCTA) image of the DCP before treatment in patient 1. Yellow circles indicate microaneurysms (MAs). Visual acuity was 20/22. (B) The enface image showing the area of macular edema. (C) The corresponding OCT cross-sectional image through the fovea is shown directly below. Macular edema involving the fovea is apparent and central retinal thickness (CRT) is 543 µm. The retinal vascular area is 4.02 mm2. (D) OCTA image of the DCP 8 months after treatment. The patient received one intravitreal aflibercept injection. The MAs disappeared. Visual acuity was 20/20. (E) The enface image. (F) The corresponding OCT cross-sectional image. Macular edema involving the fovea is resolved and CRT is 263 µm. The retinal vascular area is 4.19 mm2. (G) OCTA image of the DCP before treatment in patient 2. Yellow circles indicate microaneurysms (MAs). Visual acuity was 20/29. (H) The enface image showing the area of macular edema. (I) The corresponding OCT cross-sectional image through the fovea is shown directly below. Macular edema involving the fovea is apparent and CRT is 553 µm. The retinal vascular area is 4.26 mm2. (J) OCTA image of the DCP 7 months after treatment. The patient received two intravitreal aflibercept injections. The MAs are reduced but remain (yellow circle). Visual acuity was 20/20. (K) The enface image. (L) The corresponding OCT cross-sectional image. Macular edema involving the fovea is resolved and CRT is 289 µm. The retinal vascular area was 4.64 mm2. (M) OCTA image of the DCP before treatment in patient 3. Yellow circles indicate MAs. Visual acuity was 20/100. (N) The enface image showing the area of macular edema. (O) The corresponding OCT cross-sectional image through the fovea is shown directly below. Macular edema involving the fovea is apparent and CRT is 640 µm. The perfused area is 2.87 mm2. (P) OCTA image of the DCP 4 months after treatment. The patient received three intravitreal aflibercept injections. The MAs remain (yellow circle). Visual acuity was 20/100. (Q) The enface image. (R) The corresponding OCT cross-sectional image. Macular edema involving the fovea persists and CRT is 383 µm. The perfused area is 3.12 mm2.

