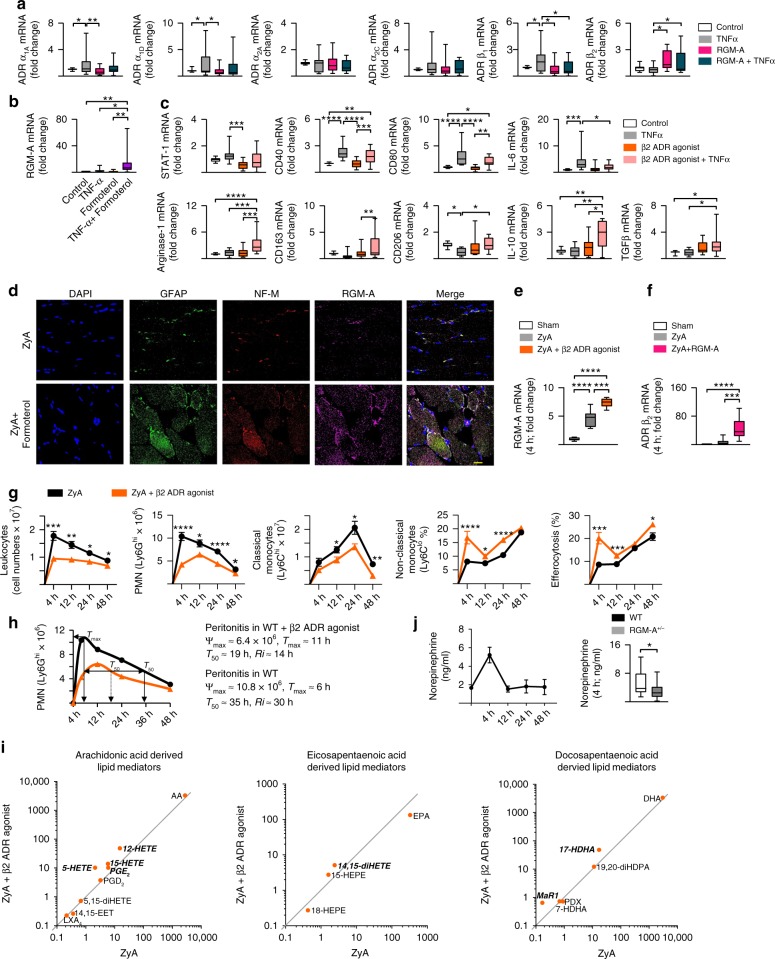
Fig. 3.
Adrenergic nerves regulate resolution of inflammation. a Human M1 MΦ were stimulated with RGM-A and subsequently with TNF-α or vehicle for 24 h. The gene expression of the α1A, α1D, α2A, α2C, β1, and β2 adrenergic receptors (ADR) was quantified by RT-PCR. Human M1 MΦ were stimulated for 24 h with the β2AR agonist and TNF-α or vehicle (n = 15). b The RGM-A mRNA was measured by RT-PCR (n = 14). c The gene expression of M1 polarization markers including STAT-1, CD40, CD80 and IL-6 as well as key genes of the M2 polarization such as Arg1, CD163, CD206, IL-10, and TGFβ were quantified by RT-PCR (n = 14). d WT animals were injected with ZyA and vehicle or β2AR agonist for 4 h. The expression of RGM-A within the neurofilament structures of peritoneum analyzed by immunofluorescence (Scale bar: 20 µm). e The expression of RGM-A mRNA was analyzed in the peritoneum by RT-PCR (n = 5). f WT mice were treated with ZyA and RGM-A or vehicle for 4 h and the gene expression of β2 ADR was measured in the peritoneum (n = 7). WT animals were injected with ZyA and with vehicle or β2AR agonist, and lavages were collected at 4, 12, 24, and 48 h. g The total leukocytes were enumerated by light microscopy, and the PMNs by flow cytometry. The classical and non-classical monocytes as well as the MΦ phagocytosis rate were determined by flow cytometry (n = 14). h Resolution indices as defined in ref. 19. i Levels of bioactive lipid mediators and precursors including the AA, EPA and DHA pathway were quantified by LC-MS/MS-based profiling in peritoneal fluids of WT animals that were treated with ZyA and β2AR agonist or vehicle for 4 h. The data are shown as the geometric mean in ng per 107 cells of peritoneal lavage and significant results are written in bold and italic (n = 9). j Norepinephrine was quantified in the peritoneal fluids of WT mice challenged to ZyA and RGM-A+/− mice and their littermates by ELISA (n = 8; n = 15 for 4 h time point). The results represent three independent experiments and are expressed as the median ± 95% CI (a–f, j (right)), geometric mean (i) and mean ± SEM (g, j (left)), one-way ANOVA with Bonferroni correction (a–c, e–f), unpaired two tailed Student’s t-test (g, i, j), *P < 0.05; **P < 0.01; ***P < 0.001, ****P < 0.0001

