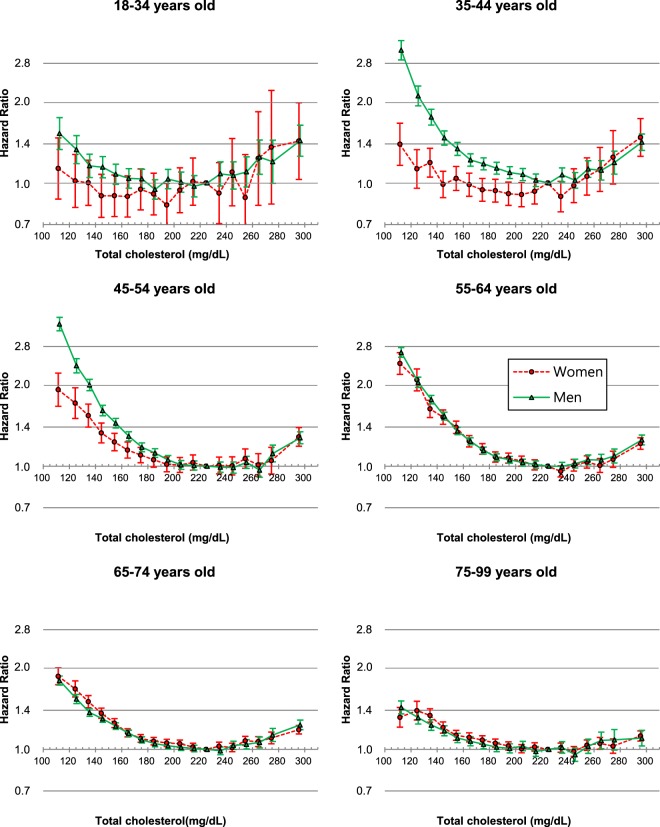
Figure 3.
Hazard ratios* associated with 18 total cholesterol (TC) categories for mortality by sex and age. TC categories (mg/dL: <120, 120–129 to 270–279 by 10, ≥280, 220–229 as reference). The midpoint was used as a representative value for each TC category, except for both ends (112 and 296), for which the median of all participants was used. *Hazard ratios and 95% confidence intervals were calculated using Cox hazards models stratified by baseline age (years: 18–24, 25–34, 35–44, 45–54, 55–64, 65–74, 75–84, 85–99), after adjustment for age at baseline (continuous variable), smoking status, alcohol use, physical activity, known history of heart disease, stroke, or cancer, body-mass index, systolic blood pressure, and fasting glucose levels. To convert TC from mg/dL to mmol/L, multiply by 0.02586.

