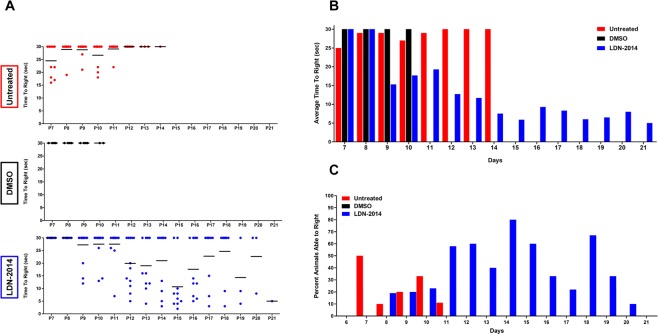
Figure 3.
Gross motor function in drug-treated SMN∆7 mice. LDN-2014 (20 mg/kg) or vehicle (DMSO) injections were administered by IP daily. (A) Scatter plot representing the individual time-to-right of each treated animal (Untreated, DMSO, LDN-2014). (B) Bar graph showing the average time-to-right of each treatment group from ages of P7 through P21, where “*” represents a significant improvement compared to the control groups. (C) Cohorts expressed as a percentage of animals able to right themselves within 30 second. Data expressed as S.E.M.

