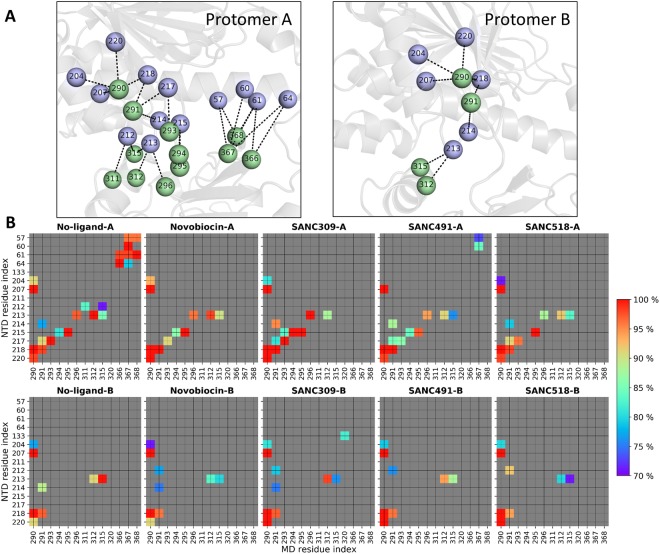
Figure 8.
Inter-domain contacts between the NTD and M-domain of each protomer. (A) Illustration of the inter-domain contacts between the NTD (violet spheres) and M-domain (green spheres) for the ligand-free ATP-only complex. (B) Time progression of key contacts between the NTD and M-domain over the course of each respective MD trajectory. Stable contacts are colored (blue – red) by percent detected over the trajectory and grey if detected <70% of the total simulation time.

