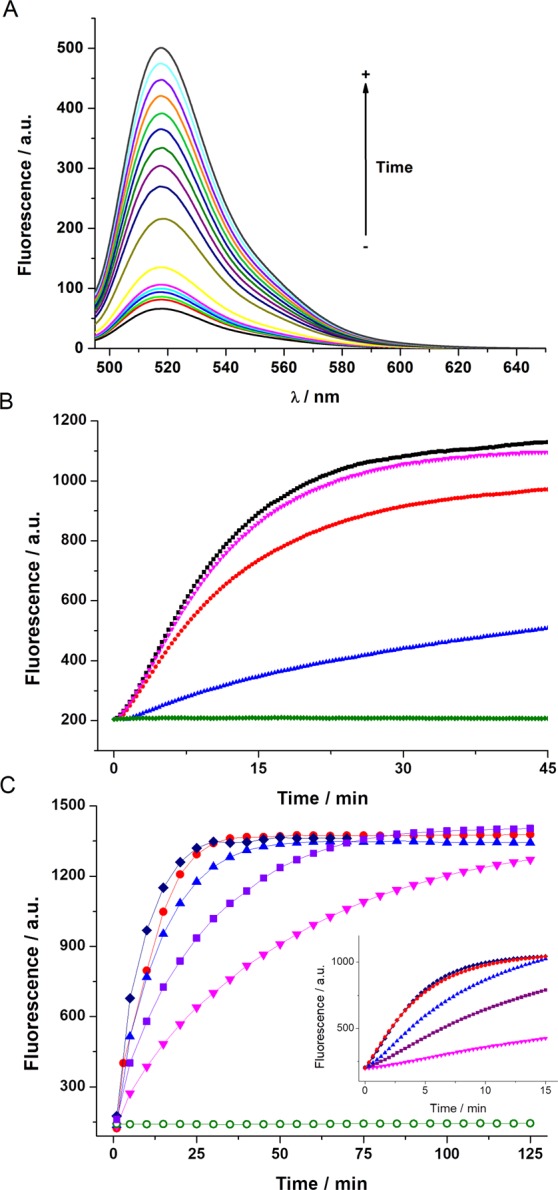
Figure 2.

(A) Fluorescence spectra of GGDNBS (4 × 10⁻⁶ M) in Tris buffer (pH 7.35) at 0, 1, 5, 7, 15, 20, 25, 30, 35, 40, 45, 50, 55 and 60 minutes after GSH addition (4 × 10⁻⁴ M). (B) Kinetics of GGDNBS (4 × 10⁻⁶ M) fluorescence increase after adding GSH (1 mM) (black), GSH (1 mM) + 0.1 mM NMM (pink), GSH (1 mM) + 0.5 mM NMM (red), GSH (1 mM) + 1 mM NMM (blue) and 1 mM NMM (green) in Tris buffer (pH 7.35). The data were obtained using a set excitation/emission of 485/520 nm (C) Kinetics of GGDNBS (4 × 10⁻⁶ M) fluorescence increase after adding GSH at 0 mM (open circles), 0.1 mM (inverted triangles), 0.5 mM (squares), 1 mM (triangles), 3 mM (circles) and 6 mM (diamonds) in Tris buffer (pH 7.35). The data were obtained using a set excitation/emission of 485/520 nm. Inset shows the high resolution time kinetic curves during the first 15 minutes.
