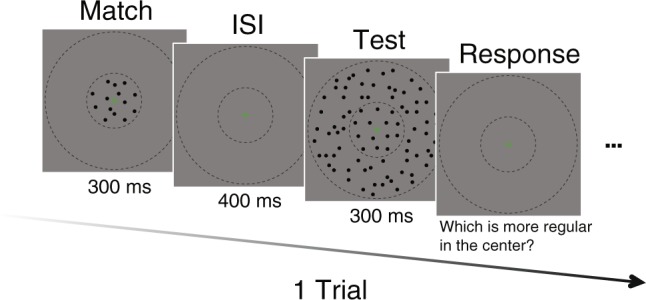
Figure 3.

The stimulus presentation protocol for a trial. A match stimulus was presented first for 300 ms, followed by 400 ms ISI, and then a test stimulus was presented for 300 ms. Observers chose the more regular pattern between match and test stimuli in the center region using a numeric keypad. A green fixation mark was shown throughout the experiment. The dashed circles indicated the center and surround regions, which were not visible in the actual experiment. This schematic depiction is for demonstration purposes, and the actual size and scale of stimuli are as described in ‘Methods’.
