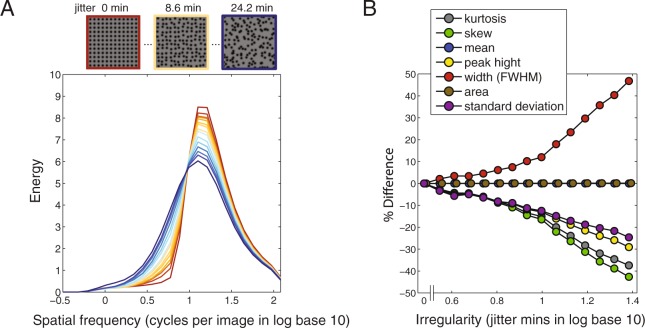
Figure 7.
Gabor wavelet analysis results for stimulus images at fifteen regularity levels, as functions of spatial frequency. The stimulus images (256 × 256 pixels each, as shown in A, top) were filtered by odd-symmetric oriented Gabor filters with a wide range of spatial frequencies. Then the pixelwise root-mean-square responses (i.e. energy) of the filtered images were calculated and normalized by the square of the filter sizes, as plotted in (A), from high regularities (dark orange lines, which are sharper) to low regularities (dark blue lines, which are flatter). Each line represents averaged spatial frequency distribution across four orientations of Gabor filters (vertical, horizontal and ± 45 degree oblique) and nine sample images. For each distribution in (A), we calculated its kurtosis, skew, mean, peak height (maximum), width (full width at half maximum, FWHM), area under the curve, and standard deviation. The value of each statistic is calculated across the fifteen regularity levels and normalized to the value at the most regular condition (jitter 0 min). The plot in (B) shows the percentage difference compared with the jitter 0 min condition for each type of statistic. The width of spatial frequency distribution increases with irregularity, while kurtosis, skew, peak height and standard deviation decrease with it.

