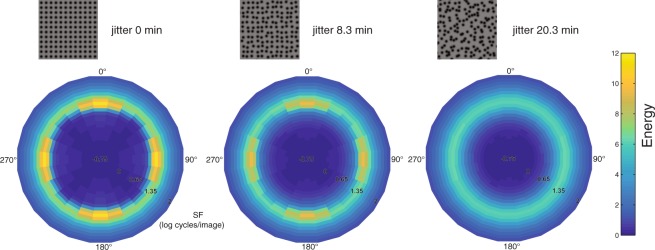
Figure 8.
Gabor wavelet analysis results for stimulus images of three regularity levels (0, 8.3 and 20.3 jitter min) shown as polar image plots of average energy (calculated as for Fig. 7A) as a joint function of spatial frequency (distance from center) and orientation (polar angle). The polar images are generated using the Matlab function ‘polarPcolor’ created by Etienne Cheynet (www.mathworks.com/matlabcentral/fileexchange/49040-pcolor-in-polar-coordinates). Average energy responses were obtained across a broad range of spatial frequencies, and at each of 12 orientations of Gabor filters (0–165 degrees, with a 15-degree spacing, and 180 deg-opposite values re-plotted symmetrically). Higher energy responses are concentrated around the grid orientations (vertical and horizontal) and peak SF (1.08 log cycles/image) for regular texture (left), with the energy gradually spreading out across orientations with increasing irregularity (middle to right).

