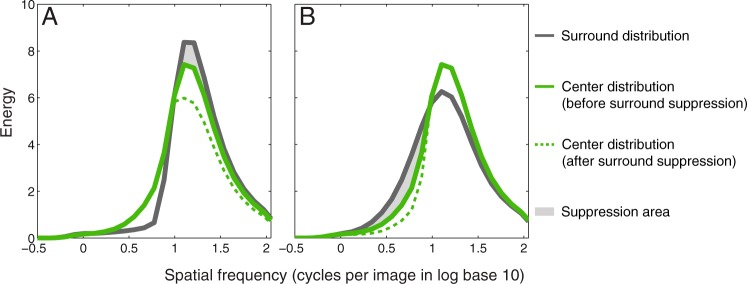
Figure 9.
Examples of channel-selective simultaneous contrast-contrast approach to explain SRC. Solid green lines in both graphs show the SF distribution with center regularity 8.34 jitter arcmin without surround suppression, using the same analysis as Fig. 7A. The grey lines represent the SF distribution of a more regular surround (A, 0 jitter arcmin) and a less regular surround (B, 20.31 jitter arcmin). Dotted green lines represent the center distribution after surround suppression though simultaneous contrast-contrast. The regular surround (A) and irregular surround (B) suppress center responses in different SF bands (grey areas). As a result, the center distribution becomes flatter, and therefore is perceived as more irregular in the presence of a more regular surround (A). However in (B) the center distribution becomes sharper and therefore is perceived as more regular in the presence of a more irregular surround.

