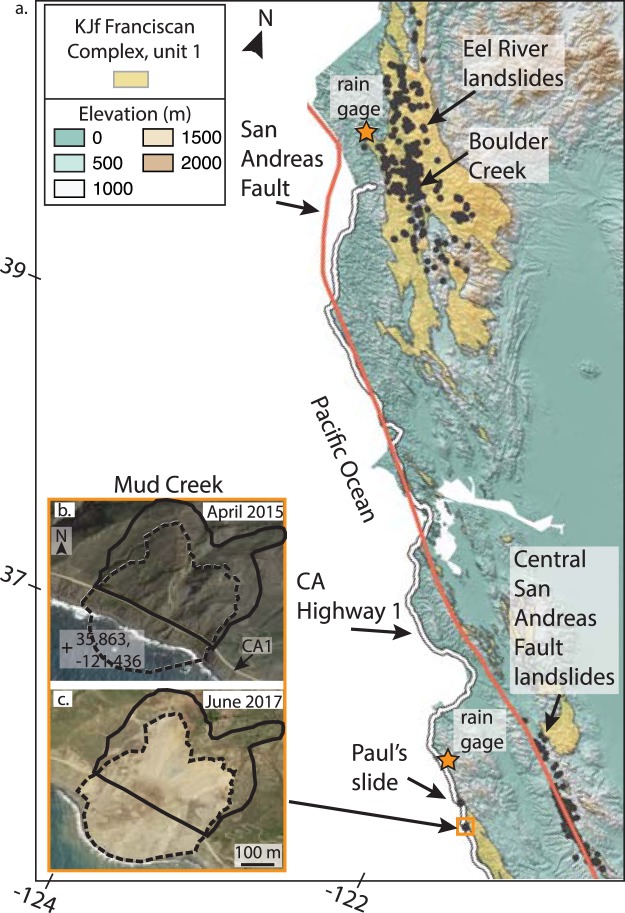
Figure 1.
Northern and Central California Coast Ranges. (a) Elevation and Franciscan Complex lithologic unit 1 and San Andreas fault28 draped over a hillshade of the topography. Black polygons show mapped inventories of slow-moving landslides22–25. Map data: Geologic map from USGS28 (https://mrdata.usgs.gov/geology/state), digital elevation models from TanDEM-X. TanDEM-X data used is under copyright by the DLR. (b,c) Google Earth images (Map data: SIO, NOAA, U.S. Navy, NGA, GEBCO; Image; Landsat/Copernicus) of the Mud Creek landslide before and after catastrophic failure. Solid black and dashed black polygons shows pre- and post-catastrophic failure landslide boundaries. We mapped the pre-catastrophic failure boundaries using InSAR, Google Earth, and a digital elevation model. We mapped the post-catastrophic failure landslide boundaries using Google Earth. Software: QGIS Geographic Information System. Open Source Geospatial Foundation Project. http://qgis.osgeo.org.

