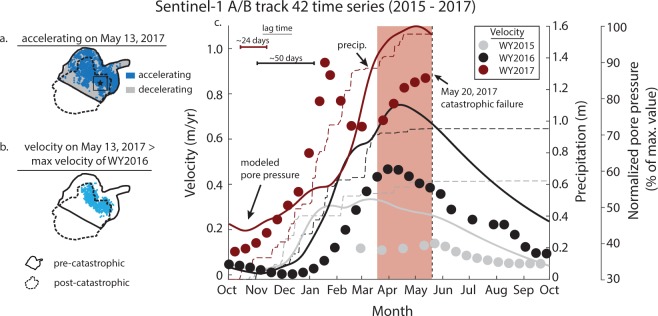
Figure 3.
Velocity time series of Mud Creek landslide. (a) Parts of the landslide that were accelerating on May 13, 2017. (b) Parts of the landslide with velocities greater than the maximum velocities during WY2016. (c) Downslope velocity, precipitation, and modelled pore-fluid pressure time series during WY2015-WY2017 condensed into a single calendar year for a representative area (averaged over 60 × 60 m, shown by black box and star in (a); Extended Data Fig. 5). The normalized pore-fluid pressure is defined as the pore-fluid pressure divided by the maximum value over the study period. Lag time corresponds to the time between the onset of precipitation and onset of acceleration. Red rectangle highlights the divergence from the characteristic seasonal velocity pattern.

