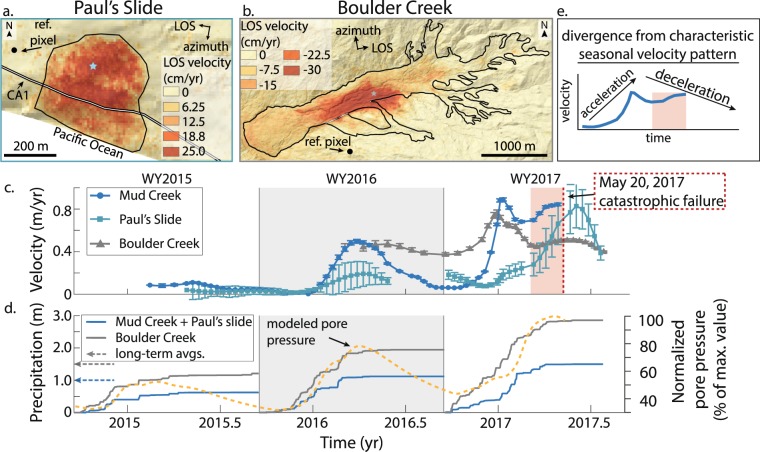
Figure 4.
Sentinel-1 A/B velocity time series comparison. (a,b) Average LOS velocity for Paul’s Slide and Boulder Creek landslide draped over a hillshade of the topography. Negative values correspond to motion towards the satellite line-of-sight (LOS). CA1 shown with black and white line. Reference pixel corresponds to a stable area outside the landslide. Black polygons show landslide boundaries. (c) Velocity time series projected onto the downslope direction for representative areas of each landslide (blue and grey stars in a and b). Error bars show the uncertainty estimates calculated using a Jackknife test (Methods). Due to low coherence in many of the interferograms, we do not have a complete time series for Boulder Creek or Paul’s Slide. (d) Precipitation time series for the Central and Northern California Coast Ranges and modelled pore-fluid pressure for Mud Creek. Rain gage locations shown in Fig. 1. (e) WY2017 velocity time series for Mud Creek highlighting the divergence from the characteristic seasonal velocity pattern of slow-moving landslides in the California Coast Ranges (highlighted by red rectangle). Map data: Digital elevation models from OpenTopgraphy (http://www.opentopography.org) and TanDEM-X. TanDEM-X data used is under copyright by the DLR. All rights reserved, used with permission. Software: QGIS Geographic Information System. Open Source Geospatial Foundation Project. http://qgis.osgeo.org.

