Fig. 4.
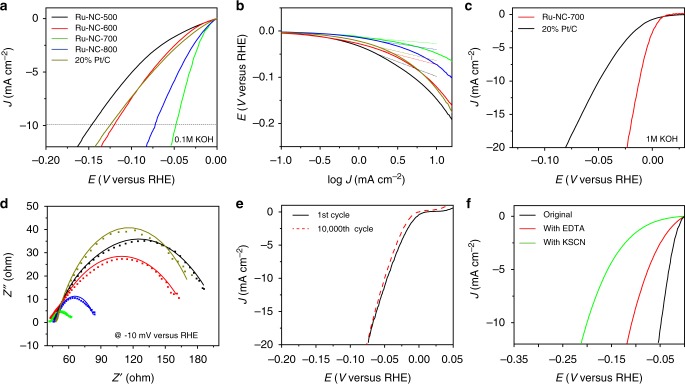
Electrochemical measurements. a Linear sweep voltammetric (LSV) curves of Ru-NC-T and commercial 20 wt% Pt/C in 0.1 M KOH. b Tafel plots of Ru-NC-T and 20% Pt/C. The legends are the same as those in a. c LSV curves of Ru-NC-700 and 20% Pt/C in 1 M KOH. d Nyquist plots of Ru-NC-T and 20% Pt/C in 0.1 M KOH at −10 mV vs. RHE. The legends are the same as those in a. Symbols are experimental data and solid curves are fits by Randles’ equivalent circuit. e Stability test of Ru-NC-700 in 0.1 M KOH, before and after 10,000 cycles within the potential window of −0.05 V to +0.05 V vs RHE. f Catalyst poisoning experiment for Ru-NC-700 in 0.1 M KOH with the addition of 10 mM of ethylenediaminetetraacetic acid (EDTA, red curve) or 10 mM of potassium thiocyanate (KSCN, green curve)

