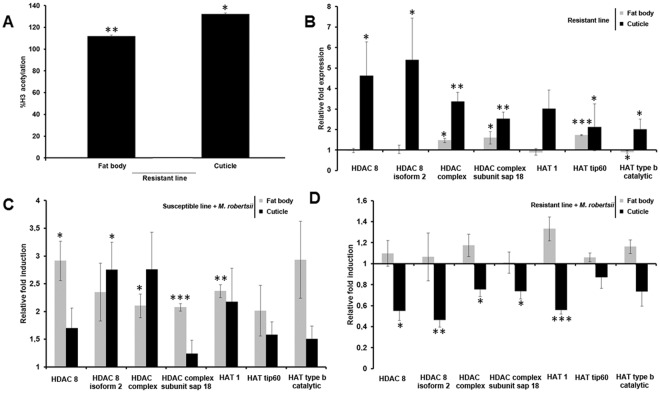
Figure 3.
Tissue-specific differences in histone acetylation between resistant and susceptible G. mellonella larvae. (A) Global histone H3 acetylation levels in the cuticle and fat body of R−relative to S− larvae. Data are means of three independent experiments with standard deviations (*p < 0.05, **p < 0.005). (B–D) Expression level of genes encoding HDAC 8, HDAC 8 isoform 2, HDAC complex, HDAC complex subunit sap18, HAT1, HAT tip60 and HAT type b catalytic in the fat body and cuticle of (B) R− larvae relative to S− larvae (*p < 0.005, **p < 0.005, ***p < 0.0005), (C) S+ larvae relative to S− larvae (*p < 0.005, **p < 0.005, ***p < 0.0005), and (D) R+ larvae relative to R− larvae(*p < 0.05, **p < 0.005, ***p < 0.0005). The 18 S rRNA housekeeping gene was used for internal data normalization. Data are means of three independent experiments with standard errors. Names of larval cohorts: R+ infected resistant; R− uninfected resistant; S+ infected susceptible; S− uninfected susceptible.

