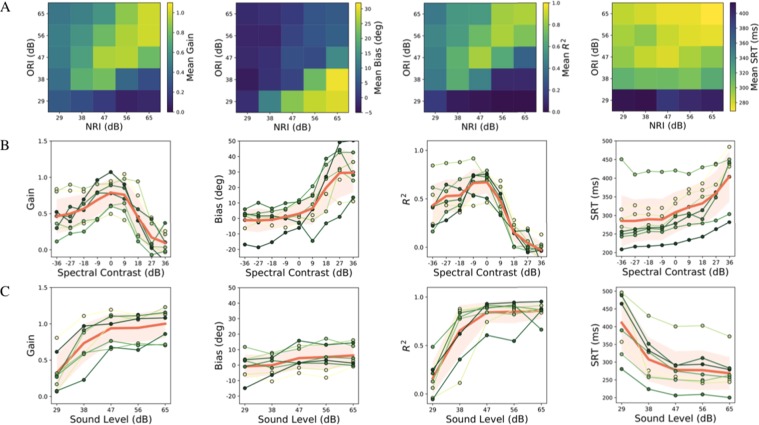
Figure 3.
(A) Average effect of NRI and ORI, (B) influence of spectral contrast (given by NRI-ORI, i.e. along the anti-diagonals), and (C) influence of sound level (along the main diagonal) on elevation gain (left column), elevation bias (second column), localization precision (r2) (third column), and reaction times (right column), averaged across listeners. The thick solid orange line and shaded orange area indicate mean and standard deviation, respectively. Green lines: results from individual participants. Note that elevation gain and precision were maximal at near-zero contrast, and that the non-monotonic dependence on contrast was asymmetric. For high positive contrasts, the response gain and precision rapidly approached zero, while the upward bias rapidly increased. The response reaction times increased systematically with increasing (positive) spectral contrast, and with decreasing sound level.

