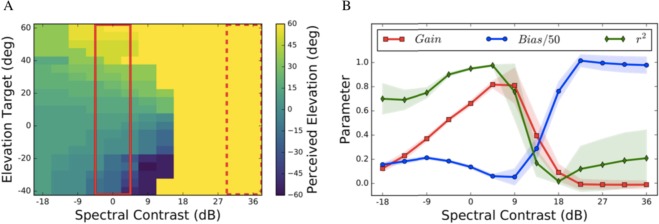
Figure 5.
Simulation results of the model (Fig. 4) using a parameterized approximation of HRTFs (Fig. S4A), and a spectral weighting function with α1 = 4.5, α2 = 1.5 (see Methods, and Fig. S4B). (A) Perceived elevation is color-coded for different spectral contrasts, and actual source elevations. Solid red box: results for flat noise (zero contrast). Dashed red box: result for high positive contrast, yielding strong upward biases. Note also the presence of up-down confusions at moderate positive contrasts (at around +12 db). (B) The simulations agree qualitatively with the experimental data of Fig. 3B. Red line: response accuracy (gain) as function of contrast is asymmetrically shaped; blue: response bias (note different scale; in deg); green: response precision (r2).

