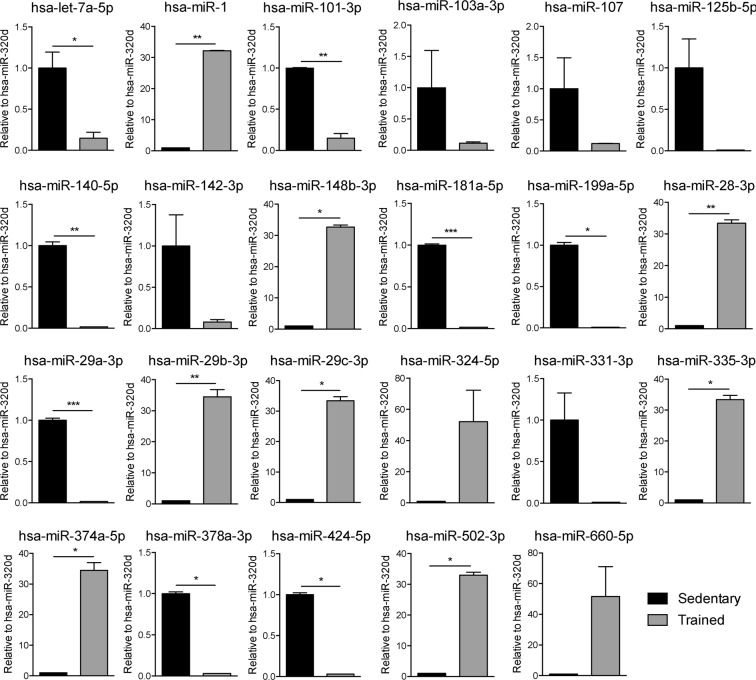
Figure 5.
Expression profile of miRNAs of sedentary and trained subjects associated to skeletal muscle and bone. Expression profile of miRNAs from sedentary and trained subjects which function is associated to skeletal muscle and bone (hsa-let-7a-5p, hsa-miR-1, hsa-miR-101-3p, hsa-miR-103a-3p, hsa-miR-107, hsa-miR-125b-5p, hsa-miR-140-5p, hsa-miR-142-3p, hsa-miR-148b-5p, hsa-miR-181a-5p, hsa-miR-199a-5p, hsa-miR-28-3p, hsa-miR-29a-3p, and hsa-miR-29b/c-3p, hsa-miR-324-5p, hsa-miR-331-3p, hsa-miR-335-5p, hsa-miR-374a-5p, hsa-miR-378-3p, miR-424-5p, hsa-miR-502-3p, and hsa-miR-660-5p). Statistical analysis was performed with Prism® v6.01 (GraphPad Software). All data are expressed as mean ± SEM and data were compared throughout unpaired t-test with Welch’s correction. The differences were considered significant when p value < 0.05 (*p < 0.05, **p < 0.01, ***p < 0.001).

