Abstract
The outbreak of the Ebola virus has resulted in significant morbidity and mortality in the affected areas, and Ebola virus RNA has been found in the semen of the survivors after 9 months of symptom onset. However, the role that sexual transmission played in the transmission is not very clear. In this paper, we developed a compartmental model for Ebola virus disease (EVD) dynamics, which includes three different infectious routes: contact with the infectious, contact with dead bodies, and transmission by sexual behaviour with convalescent survivors. We fitted the model to daily cumulative cases from the first reported infected case to October 25, 2014 for the epidemic in Sierra Leone, Liberia and Guinea. The basic reproduction numbers in these countries were estimated as 1.6726 (95%CI:1.5922–1.7573), 1.8162 (95%CI:1.7660–1.8329) and 1.4873 (95%CI:1.4770–1.4990), respectively. We calculated the contribution of sexual transmission to the basic reproduction number R0 as 0.1155 (6.9%), 0.0236 (2.8%) and 0.0546 (3.7%) in Sierra Leone, Liberia and Guinea, respectively. Sensitivity analysis shows that the transmission rates caused by contacts with alive patients and sexual activities with convalescent patients have stronger impacts on the R0. These results suggest that isolating the infectious individuals and advising the recovery men to avoid sexual intercourse are efficient ways for the eradication of endemic EVD.
Introduction
The Ebola virus, a member of the filoviridae virus family, caused an unprecedented outbreak in West Africa in 2014 which was counted as the largest Ebola epidemic ever observed. The disease, which spreads in humans and other mammalian populations, has an average death rate of about 70%1,2. The incubation period of Ebola can last from 2 to 21 days, usually 8–10 days3. There is not enough information indicating patients being infectious to another people at latency. After the incubation period, patients show sudden onset of fever, sore throat, muscle pain, and headaches. Then the illness becomes more acute with vomiting, diarrhea, body rash, tremors and in some cases, internal and external bleeding4.
Ebola is transmitted person-to-person primarily via direct contact with body fluids, secretions, tissue, contaminated surfaces and materials, from living, infected or recently deceased people5. The burial ceremonies and handling of dead bodies play a key role in transmission of the Ebola virus, because dead but not buried bodies can still transmit the virus. Family and community members exposed to the funerals present an exceptionally high risk for disease contamination6,7.
Recent reports suggest that the virus can persist in the semen of convalescent survivors for several months8–17, and as an instance, sexual transmission has been confirmed from studies shown that the semen of male survivor was positive by reverse transcription polymerase chain reaction (RT-PCR)11. On May 7th, 2015, the WHO recommended testing the semen from male Ebola survivors monthly, until their semen tests showed negative twice by RT-PCR8. Though the majorly affected countries Sierra Leone, Liberia and Guinea, are declared free of Ebola. Leaving more than 17,000 survivors, 3 cases of sexual transmission have been documented from these countries8. Sexual transmission of Ebola from convalescent survivors is a rare event, but researchers have warned that it should be considered in epidemiological models to understand the trajectory of an outbreak16.
A number of mathematical models have been developed to understand the transmission dynamics of Ebola and other infectious diseases outbreak from various aspects (see for instance15,16,18–45). Furthermore, several mathematical studies for the transmission dynamics only focus on the direct transmission or only consider sexual transmission: Lewnard et al. constructed a mathematical model with individuals divided into susceptible, latently infected, infectious, recovered and infectious people who have died from the disease33. They fitted the model to the reported cumulative Ebola cases and deaths in Montserrado County, Liberia, and assessed various intervention strategies in controlling the spread of Ebola virus in the country. In another study, Drake et al. carried out a multi-type branching process model and used time-dependent parameters to reflect increasing intensity of intervention efforts, incorporate the rates of hospitalization, exposure of healthcare workers, and secure burial34. Similarly, Barbarossa et al. developed a compartmental model including virus transmission in the community, at hospitals, and at funerals, and they derived a final epidemic size by forecasting the total number of cases during the outbreak27. In a recent study, Abbate et al. developed an SEIR compartmental model that includes sexual transmission from convalescent survivors16. Using the model, they evaluated the potential effect of sexual transmission on Ebola virus epidemiologically. Similarly, Vinson et al. presented a mathematical model that comprised the direct contact and sexual transmission modes15. Mathematical analysis showed that reducing sexual transmission could play a significant role in eradication of the disease. Gao et al.45 presented a mathematical model to investigate the impact of mosquito-borne and sexual transmission on spread and control of ZIKV and used the model to fit the ZIKV data in Brazil, Colombia, and El Salvador.
Inspired by these previous literatures, in this paper, without aiming to make a predictive model but rather to understand how the epidemic was affected by various transmission routes which include contact with infections, contact with dead bodies, and having sex with convalescent survivors, we develop a mathematical model which considers the three main features of the disease transmission and fit to the reported cumulative case data of infected cases in Sierra Leone, Liberia, and Guinea.
The article is organized as follows. In Section 2, we introduce the EVD model and present the expression of the basic reproduction number, and introduce the data sources. The model fitting and contribution of related component to the basic reproduction number R0 in Sierra Leone, Liberia and Guinea are carried out in Section 3. In Section 4, we give a brief summary and some discussions.
Methods and Materials
Model Formulation
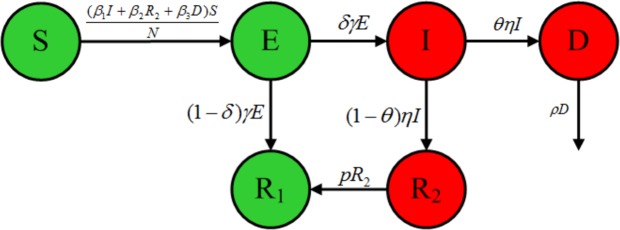
To study the transmission of Ebola in West Africa we developed a EVD model, where the population is divided into six groups: the susceptible individuals S, exposed individuals E, symptomatic and infectious individuals I, deceased infected individuals D, convalescent survivors who maintain active Ebola virus replication R2, and fully recovered and immune people R1, such that the total population is N = S + E + I + R1 + R2 + D. According to the natural history of EVD, some people have an innate immunity to Ebola and the diseases may not be fatal to all46,47, so the exposed individuals may go directly to the recovery class R1. Because we considered a relatively short time frame (<1 year), we assumed for simplicity that the total population is constant and hence we omit population births and deaths when modeling the outbreak. Additionally, we assumed that people who recover from the Ebola infection develop antibodies that last for at least 10 years, so recovered individuals will not move to compartment S in a short time. A flow of individuals from one class to another is depicted in Fig. 1. The transmission process of Ebola virus is then described by the following a system of six ordinary differential equations:
| 1 |
Figure 1.
Compartmental diagram of the Ebola transmission model.
We assumed susceptible individuals S could be infected via three paths: person-to-person transmission β1, sex with convalescent survivors β2 and deceased individuals β3. 1/γ and 1/η represent the average durations of incubation and infection, respectively. δ represents the proportion of exposed E progress to the infectious I, θ is the case fatality rate. Deceased individuals can be buried directly during funerals at rate ρ. The average duration for convalescent patients to recover is assumed as 1/p.
Basic reproduction number
The basic reproductive number R0 is the average number of secondary cases caused by an infectious individual during his/her entire infectious period. To calculate R0, we used the next generation matrix method48,49, where
| 2 |
Then
| 3 |
V −1 is given by
| 4 |
Thus
| 5 |
The reproduction number is given by ρ(FV−1), and
In order to interpret R0 in terms of the dynamics of Ebola spread, the basic reproduction number for the system breaks down to three components: the new infection induced by contacts with infectious individuals RI, sexual activities with convalescent survivors RS, and contacts with dead bodies RD.
Data and Parameter Estimation
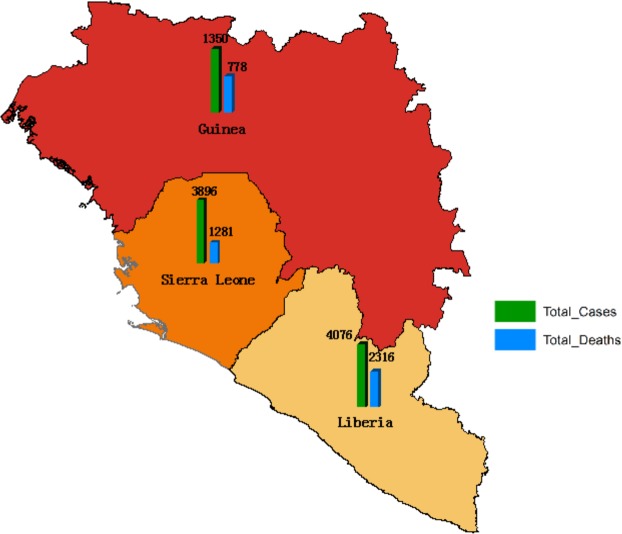
We obtained data of the daily cumulative cases which is publicly available online from the Centers for Disease Control and Prevention50, which allows the user to obtain information about the daily number of Ebola cases (confirmed, probable and deaths) in Guinea, Sierra Leone, Liberia. We used the start date for each country as when the first infectious case was reported. According to the available data provided by the CDC, the first cases reported were on May 27th, 2014 for Sierra Leone, March 27th, 2014 for Liberia and March 25th, 2014 for Guinea. As of October 25, 2014, the cumulative cases and deaths in each country are shown in Fig. 2. We use the cumulative cases up to October 25, 2014 to fit model (1).
Figure 2.
The Ebola cumulative cases during the outbreaks in Sierra Leone, Liberia and Guinea, up to October 25th, 2014.
The values of parameters for model (1) are summarized in Table 1. To parameterize our model, we adopted the epidemiological parameters from literatures. For the total population size, N, we used a total population of 7,079,162 for Sierra Leone, 4,390,737 for Liberia, and 11,805,509 for Guinea, as provided by the World Bank51. In view of the reported cases from the EVD outbreak in West Africa in 2014, we chose the mean incubation period 1/γ as 9.31 days and the mean infectious duration 1/η as 7.41 days. The average duration from death to burial 1/ρ is assumed as 2 days. The disease-related death rations, θ, according to previous studies52, were the case fatality rates 0.690 for Sierra Leone, 0.723 for Liberia, and 0.707 for Guinea. We assume that Sierra Leone, Liberia and Guinea share the same values of γ, η, and ρ [see Table 1].
Table 1.
Parameter descriptions and estimations.
| Parameter | Sierra Leone | Liberia | Guinea | Description | Source |
|---|---|---|---|---|---|
| N | 7,079,162 | 4,390,737 | 11,805,509 | Total human population | 51 |
| 1/γ | 9.31 days | 9.31 days | 9.31 days | Mean incubation period | 35 |
| 1/η | 7.41 days | 7.41 days | 7.41 days | Mean infection period | 35 |
| θ | 0.690 | 0.723 | 0.707 | Case fatality rate | 3 |
| 1/ρ | 2 days | 2 days | 2 days | Mean time from death to burial | 16 |
| 1/p | 87.35 days | 87.35 days | 87.35 days | Mean time to convalescent survivors recover completely | 52 |
| β 1 | 0.1320 [0.1298, 0.1332] | 0.1723 [0.1708, 0.1746] | 0.1561 [0.1510, 0.1588] | transmission rate of contacting alive infections patients | [Fitted] |
| β 2 | 0.0054 [0.0008, 0.0084] | 0.0037 [0.0013, 0.0049] | 0.0021 [0.0014, 0.0033] | Sexual transmission rate | [Fitted] |
| β 3 | 0.4711 [0.4491, 0.4866] | 0.5049 [0.4930, 0.5226] | 0.2443 [0.2284, 0.2740] | transmission rate of contacting dead bodies | [Fitted] |
| δ | 0.9511 [0.9219, 0.9697] | 0.8639 [0.8525, 0.8733] | 0.9584 [0.9353, 0.9682] | proportion of removed infection individuals | [Fitted] |
| R 0 | 1.6726 [1.5922, 1.7573] | 1.8162 [1.7660, 1.8329] | 1.4873 [1.4770, 1.4990] | The basic reproduction number | [Calculated] |
| R I | 0.9331 [0.9048, 0.9480] | 1.1053[1.0895, 1.1161] | 1.0890 [1.0473, 1.1174] | The infectious class’s contribution to R0 | [Calculated] |
| R S | 0.1155 [0.0066, 0.2343] | 0.0236 [0.0860, 0.1034] | 0.0546 [0.0335, 0.0853] | The convalescent class’s contribution to R0 | [Calculated] |
| R D | 0.6218 [0.6075, 0.6479] | 0.6250 [0.6138, 0.6408] | 0.3493 [0.3148, 0.3705] | The death class’s contribution to R0 | [Calculated] |
Although some parameters are not available, we can still make some reasonable assumptions. We used the value 87.35 for 1/p based on published values from the literature, and for all three countries.
We model cumulative cases as a Poisson-distributed random variable because the Poisson distribution describes the number of observed events in an interval of time. We calibrate the model by sampling from the posterior distribution of parameter vector θ|y = {β1, β2, β3, δ}|y, where vector y is derived from and Y(t) denotes the reported cumulative cases. We conduct sampling via Markov Chain Monte Carlo using a Metropolis-Hastings acceptance rule. The posterior density is
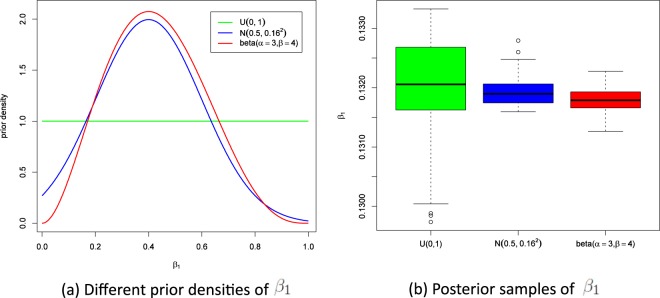
The prior density fΘ(θ) is the joint probability of four univariate priors. We consider that β1, β2, β3, and δ are distributed according to . The program was implemented in R version 3.3.1. We sampled from 30,000 MCMC iterations and discarded the first 10,000 samples as a burn-in period. On the basis of these 20,000 samples, the point estimates and 95% confidence intervals for the transmission coefficients were calculated, and the three kinds contribution to R0 can be calculated based on existing parameter values. The results are shown in Table 1. In order to check the influence of different prior distributions for estimated parameters, we choose , and beta(α = 3, β = 4) for prior distribution, respectively. The estimated values of β1 are 0.13204, 0.13189 and 0.13178 (See Fig. 3). This shows that the prior distributions have little influence on parameter β1. Similar results can be seen for parameters β2, β3, and δ.
Figure 3.
Prior densities and Posterior samples of β1.
Result
Model Fitting
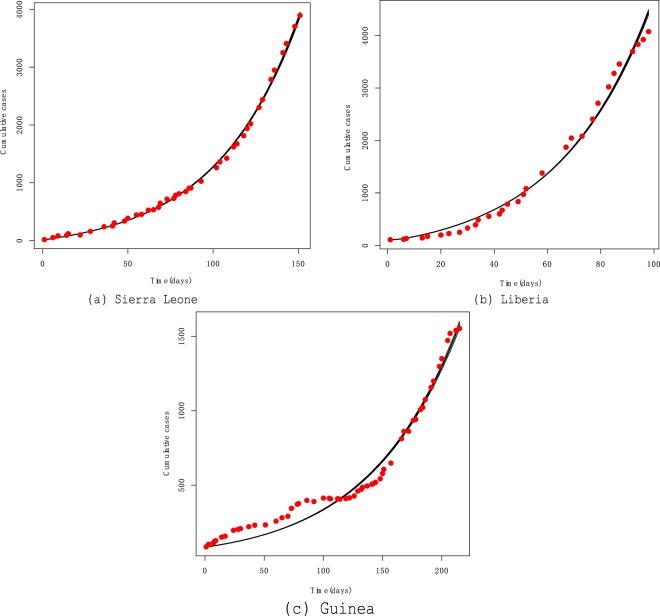
Model fitting was performed using MCMC method. In numerical experiments, the daily number of Ebola cases for each country is used to fit the cumulative number of infected cases. The model fits the cumulative reported cases in Sierra Leone, Liberia, and Guinea well generally (see Fig. 4). Figure 4 demonstrates that the fitting result of Sierra Leone is the best of these three countries, as Liberia and Guinea reported data with fluctuations, especially Guinea. In any case, the cumulative numbers of disease in October continues to increase in three countries. It should be noted that our model does not a consider any interventions, since, intervention efforts were escalated significantly after October 1, 201420.
Figure 4.
Fitting model to data in Sierra Leone, Liberia and Guinea as of October 25, 2014.
Contribution of related component to R0
Based on the model and the estimated parameter values in Table 1, we calculated the basic reproduction number R0 and 95% confidence interval in Sierra Leone, Liberia and Guinea as 1.6726 (95%CI:1.5922–1.7573), 1.8162 (95%CI:1.76601–1.8329) and 1.4873 (95%CI:1.4770–1.4990), respectively (see Fig. 5). The simulated results indicate that Liberia is the most seriously affected area in three countries at that time. In contrast, our R0 agrees with previous works summarized in Table 2. For instance, the WHO Ebola Response Team52 estimated the basic reproduction number of Ebola is in the range of [1.79, 2.26] in Sierra Leone, [1.72, 1.94] in Liberia and [1.44, 2.01] in Guinea. Similarly, Shen calculated the R0 in Sierra Leone, Liberia and Guinea, as 1.6093, 1.7994 and 1.2552, respectively26.
Figure 5.
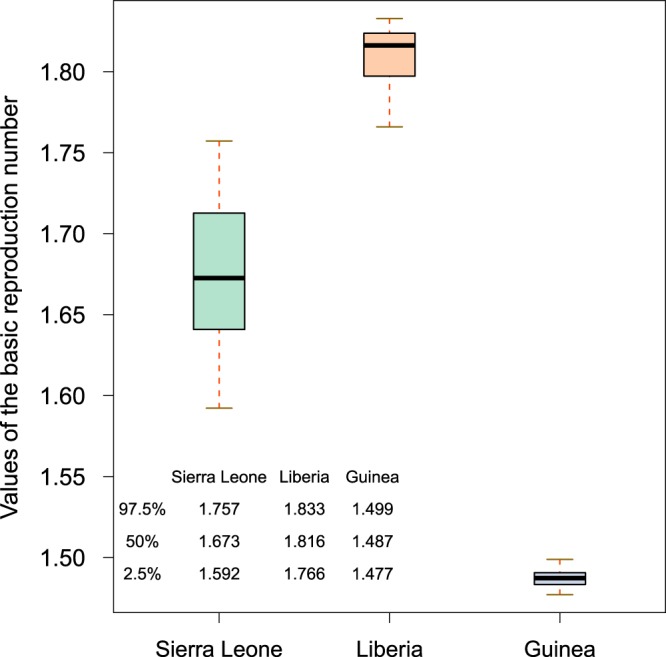
Boxplots of the basic reproduction numbers of Sierra Leone, Liberia and Guinea.
Table 2.
Comparison with previously published estimates R0.
| Location | R 0 | 95% Confidence Interval | Reference |
|---|---|---|---|
| Sierra Leone | 1.18 | — | 54 |
| 1.6093 | [1.5609, 1.6577] | 26 | |
| 1.6726 | [1.5922, 1.7573] | Obtained here | |
| 1.77 | — | 18 | |
| 2.02 | [1.79, 2.26] | 52 | |
| 2.53 | [2.41, 2.67] | 55 | |
| Liberia | 1.22 | — | 54 |
| 1.59 | [1.57, 1.60] | 55 | |
| 1.7994 | [1.7655, 1.8333] | 26 | |
| 1.8162 | [1.7660, 1.8329] | Obtained here | |
| 1.83 | — | 52 | |
| Guinea | 1.11 | — | 54 |
| 1.22 | — | 18 | |
| 1.2552 | [1.2211, 1.2893] | 26 | |
| 1.4873 | [1.4770, 1.4990] | Obtained here | |
| 1.71 | [1.44, 2.01] | 52 |
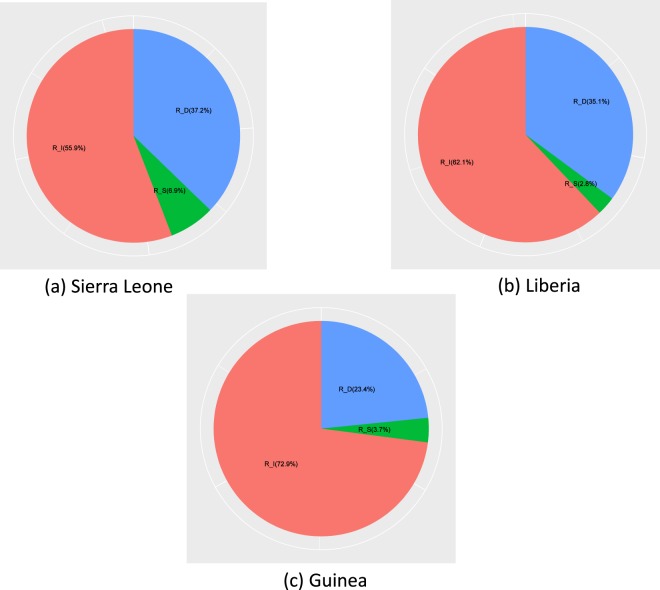
In order to understand the contribution of related components to R0 more clearly, we calculated the basic reproduction numbers of either contact with alive infectious transmission or sexual transmission or contact with dead bodies transmission (see Table 1). More precisely, in Sierra Leone, the basic reproduction numbers of infectious component RI accounted for 0.9331 (55.9%) of R0, the sexual transmission component RS accounted for 0.1155(6.9%) and the death component RD accounted for 0.6218 (37.2%). For Liberia, we obtained 1.1053 (62.1%) for RI, 0.0236 (2.8%) for RS and 0.6250 (35.1%) for RD. As for Guinea, above three components account for 1.0890 (72.9%), 0.0546 (3.7%), and 0.3493 (23.4%), respectively (see Fig. 6).
Figure 6.
The contribution of infectious component, convalescent component and death component to the basic reproduction numbers R0. The percentage is displayed with a pie chart.
We found that the infectious component basic reproduction number was around 1 in the three countries, suggesting the most important factor for the spread of the epidemic is the virus transmission via contact with alive infectious individuals. In addition, we found that the epidemic was spread through contacting dead bodies in the funeral. Thus, we conjecture that the spread of Ebola can be effectively controlled by isolation and proper handling of dead bodies. The value of RS is less than 10% in three countries, and not enough to cause an outbreak of disease. However, sexual transmission can prolong the outbreak of Ebola.
Sensitivity Analysis and Disease Control
It is well known that the basic reproduction number (R0) is a very important parameter in the infectious disease model, which determines whether the could spread. In our model, R0 is determined by the parameters of γ, θ, η, ρ, p, β1, β2, β3 and δ. In order to identify the impacts of thses parameters on Ebola transmission and prevalence, we used the Latin hypercube sampling method and partial rank correlation coefficient (PRCC)39. Using model (1), 2000 samples are randomly generated by assuming a uniform distribution for each parameter based on values from Table 1.
We choose parameters of interest as the input variables, and the value of R0 as the output variable. The PRCC values of eight parameters and corresponding p-values are computed. Given the common ways of controlling measures in three countries, and to avoid repeated work, here, we only presant Sierra Leone’s sensitivity analysis. The results of Sierra Leone are illustrated in Table 3 and shown in Fig. 7. The larger the absolute value of PRCC, the stronger the correlation between the input parameters and R0. From Table 3, it is evident that η, ρ and p have negative impact upon R0, while γ,θ, β1, β2, β3 and δ have positive impact. Furthermore, Fig. 7 shows that contact with alive infectious transmission rate β1, infectious class’s removal rate η, sexual transmission rate β2 and contact with dead bodies transmission rate β3 are the most sensitive parameters on R0.
Table 3.
Partial rank correlation coefficients (PRCCs) for R0 and each input parameter.
| Input parameter | PRCC | 95% Confidence Interval | p value |
|---|---|---|---|
| γ | 0.0001 | [−0.0291, 0.0264] | 0.8413 |
| θ | 0.2152 | [0.1584, 0.2733] | 0.0015 |
| η | −0.8468 | [−0.8655, −0.8278] | <0.0001 |
| ρ | −0.3695 | [−0.4272, −0.3122] | <0.0001 |
| p | −0.1953 | [−0.2540, −0.1375] | 0.0021 |
| β 1 | 0.9769 | [0.9648, 0.9888] | <0.0001 |
| β 2 | 0.7486 | [0.7056, 0.7916] | <0.0001 |
| β 3 | 0.5692 | [0.6227, 0.5148] | <0.0001 |
| δ | 0.2785 | [0.3343, 0.2212] | <0.0001 |
Figure 7.
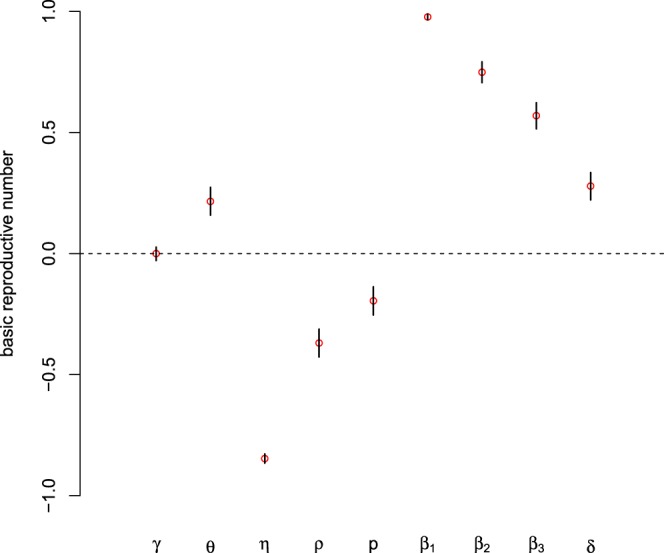
The Partial rank correlation coefficient values for model (1). The basic reproduction number (R0) was used as the response function.
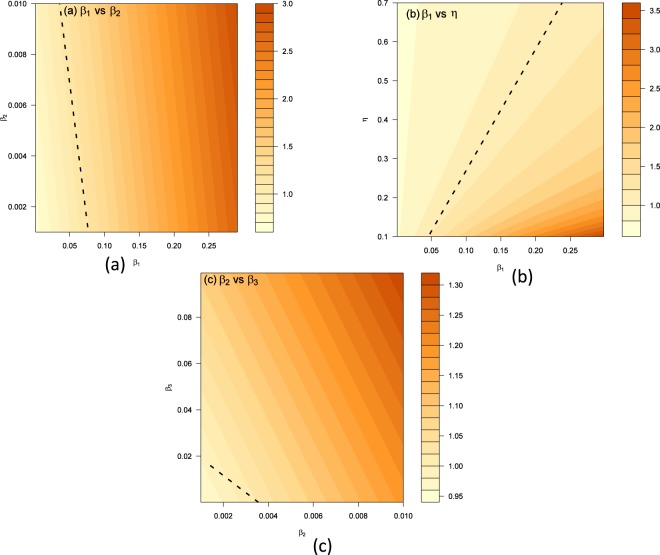
Through the result of sensitivity analysis, we focus on quantifying the effects of β1, η, β2, and β3 on the basic reproduction number. In the numerical simulations, we choose γ = 1/9.31, ρ = 1/2, p = 1/87.35, θ = 0.69, δ = 0.9511, and vary the four controllable parameters from 0.001 to 0.3 for β1, from 0.001 to 0.01 for β2, from 0.1 to 0.7 for η and from 0.0001 to 0.1 for β3. Fixing values of η and β3, β2 and β3, β1 and η simultaneously, we plot the contour figure of R0 in terms of β1 and β2, β1 and η, β2 and β3 are displayed in Fig. 8, to explain the specific value of controllable parameters when the basic reproduction number can be brought below 1.
Figure 8.
The contour plot of β1, η, β2 and β3 on the basic reproduction number R0. The black dashed curve is the contour of R0 = 1.
From Fig. 8(a,b), we find that it is possible to reduce the basic reproduction number to be below 1 with a certain range of the parameters, which means reducing the rate of contacting with infectious individuals may be an effective method to control the outbreak of Ebola. In Fig. 8(c), we show the influences of β2 and β3 on the basic reproduction number. We can see that even if we can implement proper handling of dead bodies to reduce β2, the disease is hard to be controled with a high sexual transmission outbreaks.
Conclusion and Discussion
Ebola has a high mortality rate and it has caused in many West Africa countries, especially in Sierra Leone, Liberia and Guinea in 2014, which led to many deaths. In this paper, we developed a mathematical model to explore the transmission dynamics of Ebola virus. As a comprehensive consideration of the transmission of the virus, the model includes the effect of contact with infections, contact with dead bodies, and sexual contact with convalescent survivors. Furthermore, we qualitatively analyzed the impact of sexual transmission on the prevention and control of the Ebola. By fitting the model to the cumulative numbers of infected cases (Fig. 4), we obtained some estimates of the parameters (Table 1).
Based on reasonable parameter values and the existing literature, we calculated the basic reproduction number R0 and 95% confidence interval for Sierra Leone, Liberia and Guinea as 1.67 (95%CI:1.59–1.76), 1.82 (95%CI:1.77–1.83) and 1.49 (95%CI:1.48–1.50), respectively. This indicates that Liberia is the most seriously affected country among these three countries by the end of October 25, 2014. Our results seem to be in accordance with previous work carried out in this field (Table 2).
To be more precise, we consider the contribution of different settings for transmission of Ebola to R0 with no effective control measures. In our results, the ranking proportional values of RI, RS, and RD accounting for the basic reproduction number was the same in the three countries, the biggest proportional value among the three countries is RI, then RD, and the smallest is RS. The results imply that RI and RD transmission routes play more crucial roles in the Ebola transmission in Sierra Leone, Liberia and Guinea. Similar components of R0 were identified by Barbarossa estimated RC = 0.25 (0.16, 0.29), RH = 0.15 (0.04, 0.23), and RF = 1.05 (0.48, 1.49)27, but in our study, the value of RI is the largest, which may due to the fact that RI includes both the infections generated in the community RC and that in the hospital RH in their model. However, contribution of sexual transmission to overall R0 is 0.12% in16.
Sensitivity analysis is vital to identify key parameters and find effective control strategies for combatting the spread of the disease. The result of sensitivity analysis indicates that contact with alive infectious transmission rate β1, infectious class’s removal rate η, sexual transmission rate β2 and contact with dead bodies transmission rate β3 are the most sensitive parameters to R0 than any other parameters. The simulation results show β1 imacts the most of the value of R0, which indicates that protective among the community and medical workers should be strengthened, and measures to isolate infected people in turn reduce the rate of infection in the population. Remarkably, the sexual transmission component RS accounted for 6.9%, 2.8% and 3.7% in Sierra Leone, Liberia and Guinea respectively. However, the contribution of sexual transmission to overall R0 is 0.12% in16. Our results show that the potential risk of sexual transmission will cause greater difficulties in terms of controlling the spread of EVD.
The knowledge of the potential for sexual transmission has led to the WHO to make recommendations that require recovered men to avoid sexual intercourse and use condoms as much as possible53. Moreover, the public health community must be vigilant in responding to these cases. Most of the population in the affected area are still susceptible, and as long as the virus is not eradicated, the risk of an outbreak could still be high.
Acknowledgements
This research was supported by the National Natural Science Foundation of China [11461073, 61672013] and Huaian Key Laboratory for Infectious Diseases Control and Prevention[HAP201704].
Author Contributions
Designed the project (K.W., R.Z., D.W.); performed simulations (D.L., D.W., K.W.), performed analysis of the data (D.L., X.Z., K.W.), wrote the paper (D.L., D.W., Y.Y., K.W., W.W.).
Competing Interests
The authors declare no competing interests.
Footnotes
Publisher’s note: Springer Nature remains neutral with regard to jurisdictional claims in published maps and institutional affiliations.
References
- 1.WHO. Ebola haemorrhagic fever in zaire, 1976. Bull World Health Organ56, 271–293 (1978). [PMC free article] [PubMed]
- 2.Dowell SF, et al. Transmission of ebola hemorrhagic fever: a study of risk factors in family members, kikwit, democratic republic of the congo, 1995. J. Infect. Dis. 1999;179(Suppl.):1. doi: 10.1097/00006454-199901000-00002. [DOI] [PubMed] [Google Scholar]
- 3.Legrand J, Grais R, Boelle P, Valleron A, Flahault A. Understanding the dynamics of ebola epidemics. Epidemiol. Infect. 2007;135:610C621. doi: 10.1017/S0950268806007217. [DOI] [PMC free article] [PubMed] [Google Scholar]
- 4.Okware SI, et al. An outbreak of ebola in uganda. Trop. Med. Int. Health. 2002;7(12):1068–1075. doi: 10.1046/j.1365-3156.2002.00944.x. [DOI] [PubMed] [Google Scholar]
- 5.Patel RB, Burke TF. Urbanization-an emerging humanitarian disaster. N. Engl. J. Med. 2009;361(8):741–743. doi: 10.1056/NEJMp0810878. [DOI] [PubMed] [Google Scholar]
- 6.Rachah A, Torres DFM. Modeling, dynamics and optimal control of ebola virus spread. Pure and Applied Functional Analysis. 2016;1:277–289. [Google Scholar]
- 7.Upadhyay RK, Roy P. Deciphering dynamics of recent epidemic spread and outbreak in west africa: the case of ebola virus. Int. J. Bifurcation Chaos. 2016;26(09):1630024. doi: 10.1142/S021812741630024X. [DOI] [Google Scholar]
- 8.Subtil F, et al. Dynamics of ebola rna persistence in semen: report from the postebogui cohort in guinea. Clin. Infect. Dis. 2017;64(12):1788–1790. doi: 10.1093/cid/cix210. [DOI] [PubMed] [Google Scholar]
- 9.Deen GF, et al. Ebola rna persistence in semen of ebola virus disease survivors final report. N. Engl. J. Med. 2015;377(15):1428–1437. doi: 10.1056/NEJMoa1511410. [DOI] [PMC free article] [PubMed] [Google Scholar]
- 10.Crozier I. Ebola virus rna in the semen of male survivors of ebola virus disease: the uncertain gravitas of a privileged persistence. J. Infect. Dis. 2016;214(10):1467–1469. doi: 10.1093/infdis/jiw079. [DOI] [PubMed] [Google Scholar]
- 11.Sow MS, et al. New evidence of long-lasting persistence of ebola virus genetic material in semen of survivors. J. Infect. Dis. 2016;214(10):1475–1476. doi: 10.1093/infdis/jiw078. [DOI] [PubMed] [Google Scholar]
- 12.Sissoko D, et al. Persistence and clearance of ebola virus rna from seminal uid of ebola virus disease survivors: a longitudinal analysis and modelling study. Lancet Global Health. 2017;5(1):e80. doi: 10.1016/S2214-109X(16)30243-1. [DOI] [PubMed] [Google Scholar]
- 13.Chowell G, Viboud C, Simonsen L, Merler S, Vespignani A. Perspectives on model forecasts of the 2014C2015 ebola epidemic in west africa: lessons and the way forward. BMC Med. 2017;15(1):42. doi: 10.1186/s12916-017-0811-y. [DOI] [PMC free article] [PubMed] [Google Scholar]
- 14.Soka MJ, et al. Prevention of sexual transmission of ebola in liberia through a national semen testing and counselling programme for survivors: an analysis of ebola virus rna results and behavioural data. Lancet Global Health. 2016;4(10):e736–e743. doi: 10.1016/S2214-109X(16)30175-9. [DOI] [PubMed] [Google Scholar]
- 15.Vinson JE, Drake JM, Rohani P, Park AW. The potential for sexual transmission to compromise control of ebola virus outbreaks. Biol. Lett. 2016;12(6):20151079. doi: 10.1098/rsbl.2015.1079. [DOI] [PMC free article] [PubMed] [Google Scholar]
- 16.Abbate JL, Murall CL, Richner H, Althaus CL. Potential impact of sexual transmission on ebola virus epidemiology: sierra leone as a case study. PLoS. Negl. Trop. Dis. 2016;10(5):e0004676. doi: 10.1371/journal.pntd.0004676. [DOI] [PMC free article] [PubMed] [Google Scholar]
- 17.Mate SE, et al. Molecular evidence of sexual transmission of ebola virus. N. Engl. J. Med. 2016;373(25):2448–2454. doi: 10.1056/NEJMoa1509773. [DOI] [PMC free article] [PubMed] [Google Scholar]
- 18.Webb GF, Browne CJ. A model of the ebola epidemics in west africa incorporating age of infection. J. Biol. Dyn. 2016;10(1):18–30. doi: 10.1080/17513758.2015.1090632. [DOI] [PubMed] [Google Scholar]
- 19.Towers, S., Patterson-Lomba, O. & Castillo-Chavez, C. Temporal variations in the effective reproduc-tion number of the 2014 west africa ebola outbreak. PLoS Curr. 6 (2014). [DOI] [PMC free article] [PubMed]
- 20.Eisenberg, M. C. et al. Forecasting and uncertainty in modeling the 2014-2015 ebola epidemic in west africa. Quantitative Biology (2015).
- 21.Xia ZQ, et al. Modeling the transmission dynamics of ebola virus disease in liberia. Sci. Rep. 2015;5:13857. doi: 10.1038/srep13857. [DOI] [PMC free article] [PubMed] [Google Scholar]
- 22.Guo Z, et al. Predicting and evaluating the epidemic trend of ebola virus disease in the 2014-2015 outbreak and the effects of intervention measures. PLoS One. 2016;11(4):e0152438. doi: 10.1371/journal.pone.0152438. [DOI] [PMC free article] [PubMed] [Google Scholar]
- 23.Lau MS, et al. Spatial and temporal dynamics of superspreading events in the 2014-2015 west Africa ebola epidemic. Proc. Natl. Acad. USA. 2017;114(9):2337–2342. doi: 10.1073/pnas.1614595114. [DOI] [PMC free article] [PubMed] [Google Scholar]
- 24.Agusto FB. Mathematical model of ebola transmission dynamics with relapse and reinfection. Math. Biosci. 2017;283:48–59. doi: 10.1016/j.mbs.2016.11.002. [DOI] [PubMed] [Google Scholar]
- 25.Camacho A, et al. Potential for large outbreaks of ebola virus disease. Epidemics. 2014;9:70–78. doi: 10.1016/j.epidem.2014.09.003. [DOI] [PMC free article] [PubMed] [Google Scholar]
- 26.Shen M, Xiao Y, Rong L. Modeling the effect of comprehensive interventions on ebola virus transmission. Sci. Rep. 2015;5:15818. doi: 10.1038/srep15818. [DOI] [PMC free article] [PubMed] [Google Scholar]
- 27.Barbarossa MV, et al. Transmission dynamics and final epidemic size of ebola virus disease outbreaks with varying interventions. PLoS One. 2015;10(7):e0131398. doi: 10.1371/journal.pone.0131398. [DOI] [PMC free article] [PubMed] [Google Scholar]
- 28.Li SL, et al. Essential information: uncertainty and optimal control of ebola outbreaks. Proc. Natl. Acad. USA. 2017;114(22):5659–5664. doi: 10.1073/pnas.1617482114. [DOI] [PMC free article] [PubMed] [Google Scholar]
- 29.Fang LQ, et al. Transmission dynamics of ebola virus disease and intervention effectiveness in sierra leone. Proc. Natl. Acad. USA. 2016;113(16):4488–4493. doi: 10.1073/pnas.1518587113. [DOI] [PMC free article] [PubMed] [Google Scholar]
- 30.Kucharski AJ, et al. From the cover: measuring the impact of ebola control measures in sierra leone. Proc. Natl. Acad. USA. 2015;112(46):14366–14371. doi: 10.1073/pnas.1508814112. [DOI] [PMC free article] [PubMed] [Google Scholar]
- 31.Evans RJ, Mammadov M. Dynamics of ebola epidemics in west africa 2014. F1000Res. 2014;3:319. doi: 10.12688/f1000research.5941.1. [DOI] [PMC free article] [PubMed] [Google Scholar]
- 32.Njankou SDD, Nyabadza F. Modelling the potential role of media campaigns in ebola trans- mission dynamics. International Journal of Differential Equations. 2017;1:13. [Google Scholar]
- 33.Lewnard JA, et al. Dynamics and control of ebola virus transmission in montserrado, liberia: a mathematical modelling analysis. Lancet Infect. Dis. 2014;14(12):1189–1195. doi: 10.1016/S1473-3099(14)70995-8. [DOI] [PMC free article] [PubMed] [Google Scholar]
- 34.Drake JM, et al. Ebola cases and health system demand in liberia. PLoS Biol. 2015;13(1):e1002056. doi: 10.1371/journal.pbio.1002056. [DOI] [PMC free article] [PubMed] [Google Scholar]
- 35.Althaus CL, Low N, Musa EO, Shuaib F, Gsteiger S. Ebola virus disease outbreak in nigeria: transmission dynamics and rapid control. Epidemics. 2015;11(2):80. doi: 10.1016/j.epidem.2015.03.001. [DOI] [PubMed] [Google Scholar]
- 36.Do TS, Lee YS. Modeling the spread of ebola. Osong Public Health Res. Perspect. 2016;7(1):43–48. doi: 10.1016/j.phrp.2015.12.012. [DOI] [PMC free article] [PubMed] [Google Scholar]
- 37.Yang W, et al. Transmission network of the 2014C2015 ebola epidemic in sierra leone. J. R. Soc. Interface. 2015;12(112):20150536. doi: 10.1098/rsif.2015.0536. [DOI] [PMC free article] [PubMed] [Google Scholar]
- 38.Berge T, Lubuma JM, Moremedi GM, Morris N, Konderashava R. A simple mathematical model for ebola in africa. J. Biol. Dyn. 2017;11(1):42–74. doi: 10.1080/17513758.2016.1229817. [DOI] [PubMed] [Google Scholar]
- 39.Jiang S, et al. Mathematical models for devising the optimal ebola virus disease eradication. J. Transl. Med. 2017;15(1):124. doi: 10.1186/s12967-017-1224-6. [DOI] [PMC free article] [PubMed] [Google Scholar]
- 40.Agusto FB, Tebohewungkem MI, Gumel AB. Mathematical assessment of the effect of traditional beliefs and customs on the transmission dynamics of the 2014 ebola outbreaks. BMC Med. 2015;13(1):96. doi: 10.1186/s12916-015-0318-3. [DOI] [PMC free article] [PubMed] [Google Scholar]
- 41.Rachah, A. & Torres, D. F. M. Dynamics and optimal control of ebola transmission. Math. Comput. Sci. 1–12, 10.1007/s11786-016-0268-y (2016).
- 42.Sun GQ, et al. Effects of feedback regulation on vegetation patterns in semi-arid environments. Applied Mathematical Modelling. 2018;61:200–215. doi: 10.1016/j.apm.2018.04.010. [DOI] [Google Scholar]
- 43.Li L, et al. Hemorrhagic fever with renal syndrome in China: Mechanisms on two distinct annual peaks and control measures. International Journal of Biomathematics. 2018;11(2):1850030. doi: 10.1142/S1793524518500304. [DOI] [Google Scholar]
- 44.Sun GQ, et al. Transmission dynamics of cholera: Mathematical modeling and control strategies. Commun. Nonlinear Sci. Numer. Simulat. 2017;45:235–244. doi: 10.1016/j.cnsns.2016.10.007. [DOI] [Google Scholar]
- 45.Gao D, et al. Prevention and Control of Zika as a Mosquito-Borne and Sexually Transmitted Disease: A Mathematical Modeling Analysis. Sci. Rep. 2016;6:28070. doi: 10.1038/srep28070. [DOI] [PMC free article] [PubMed] [Google Scholar]
- 46.Basler CF. Innate immune evasion by filoviruses. Virology. 2015;480:122–130. doi: 10.1016/j.virol.2015.03.030. [DOI] [PMC free article] [PubMed] [Google Scholar]
- 47.Rechtien A, et al. Systems vaccinology identifies an early innate immune signature as a correlate of antibody responses to the ebola vaccine rvsv-zebov. Cell Rep. 2017;20(9):2251–2261. doi: 10.1016/j.celrep.2017.08.023. [DOI] [PMC free article] [PubMed] [Google Scholar]
- 48.Diekmann O, Heesterbeek JAP, Metz JAJ. On the definition and the computation of the basic reproduction ratio R0, in models for infectious diseases in heterogeneous populations. J. Math. Biol. 1990;28(4):365–382. doi: 10.1007/BF00178324. [DOI] [PubMed] [Google Scholar]
- 49.Driessche PVD, Watmough J. Reproduction numbers and sub-threshold endemic equilibria for compartmental models of disease transmission. Math. Biosci. 2002;180:29–48. doi: 10.1016/S0025-5564(02)00108-6. [DOI] [PubMed] [Google Scholar]
- 50.The US Centers for Disease Control and Prevention. Ebola Virus Disease, https://www.cdc.gov/vhf/ebola/outbreaks/2014-west-africa/previous-case-counts.html.
- 51.TheWorld Bank Group. Total population (in number of people) for Guinea, Sierra Leone, and Liberia, https://data.worldbank.org/indicator/SP.POP.TOTL (2014).
- 52.Team WER. Ebola virus disease in west africa the first 9 months of the epidemic and forward projections. New Engl. J. Med. 2014;371(16):1481–1495. doi: 10.1056/NEJMoa1411100. [DOI] [PMC free article] [PubMed] [Google Scholar]
- 53.World Health Organization. Interim advice on the sexual transmission of the Ebola virus disease, http://www.who.int/reproductivehealth/topics/rtis/ebola-virus-semen/en/, (21 January 2016).
- 54.Wang XS, Zhong L. Ebola outbreak in west africa: real-time estimation and multiple-wave prediction. Math. Biosci. Eng. 2015;12(5):1055–1063. doi: 10.3934/mbe.2015.12.1055. [DOI] [PubMed] [Google Scholar]
- 55.Althaus CL. Estimating the reproduction number of ebola virus (ebov) during the 2014 outbreak in west africa. PLoS Curr. 2014;6(1):353–357. doi: 10.1371/currents.outbreaks.91afb5e0f279e7f29e7056095255b288. [DOI] [PMC free article] [PubMed] [Google Scholar]


