Figure 14.

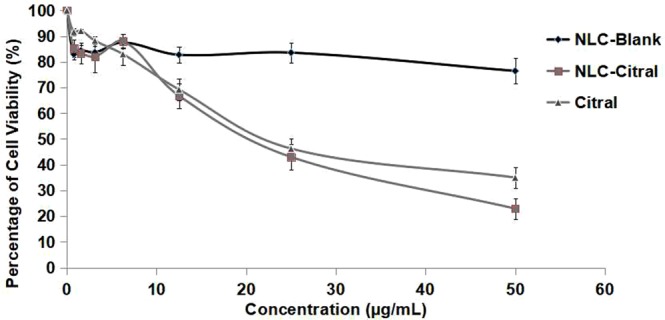
The percentage of 4T1 cells viability treated with different concentrations of NLC-Blank, NLC-Citral, and citral at 48 hours in MTT assay. Each value is represented as mean ± SD and the experiment was done in triplicate.

The percentage of 4T1 cells viability treated with different concentrations of NLC-Blank, NLC-Citral, and citral at 48 hours in MTT assay. Each value is represented as mean ± SD and the experiment was done in triplicate.