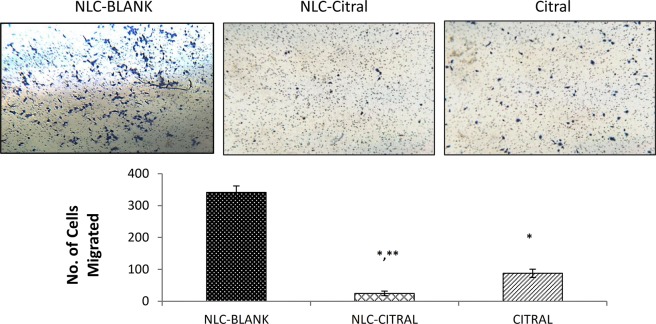
Figure 7.
The representative images and bar chart analysis of MDA MB-231 cells upon treatment with 12.5 µg/mL of NLC-Blank, NLC-Citral, and citral. The cells were allowed to migrate through the 0.8 µM pore-sized membrane. The images were viewed at 200X magnification. The experiment was done in triplicates and data are expressed as mean ± SD. Significance was set at p < 0.05 comparing between groups with (*) to NLC-Blank and (**) to citral.

