Figure 4.
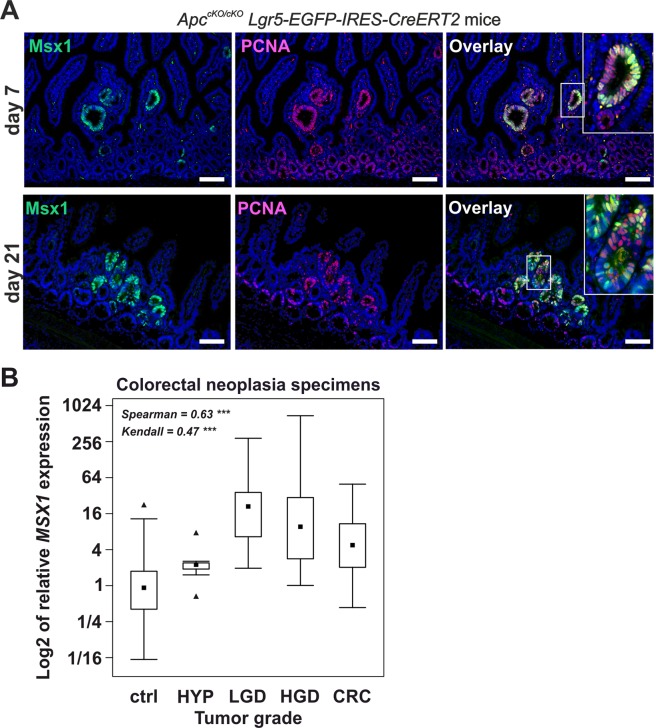
Tumor cells are Msx1-positive. (A) Immunofluorescent localization of Msx1 (green fluorescent signal) and PCNA (red florescent signal) in (micro)adenomas formed in the small intestine of ApccKO/cKO Lgr5-EGFP-IRES-CreERT2 mice. The tissue was analyzed 7 and 21 days after tamoxifen administration. Specimens were counterstained with DAPI; boxed areas are magnified in the insets. Scale bar: 0.15 mm. (B) Analysis of MSX1 expression changes during colorectal neoplasia progression. Quantitative RT-PCR analysis of the MSX1 mRNA levels in healthy tissue (ctrl), hyperplastic adenomas (HYP; n = 9), adenomas displaying low-grade (LGD; n = 27) or high-grade (HGD; n = 24) dysplasia, and CRC (n = 12). The boxed areas correspond to the second and third quartiles; the median of ΔCt values for each category is indicated as the black dot. The range of the values is given by “whiskers” above and below each box. “Outliers” are indicated by black triangles. The RNA content in individual isolates was normalized to the geometric average of Ct values of housekeeping genes UBB and β2-microglobulin. The relation between the MSX1 expression profile and neoplasia progression is significant as evidenced by the Spearman (ρ = 0.63) and Kendall (0.47) coefficient values; ***p < 0.001.

