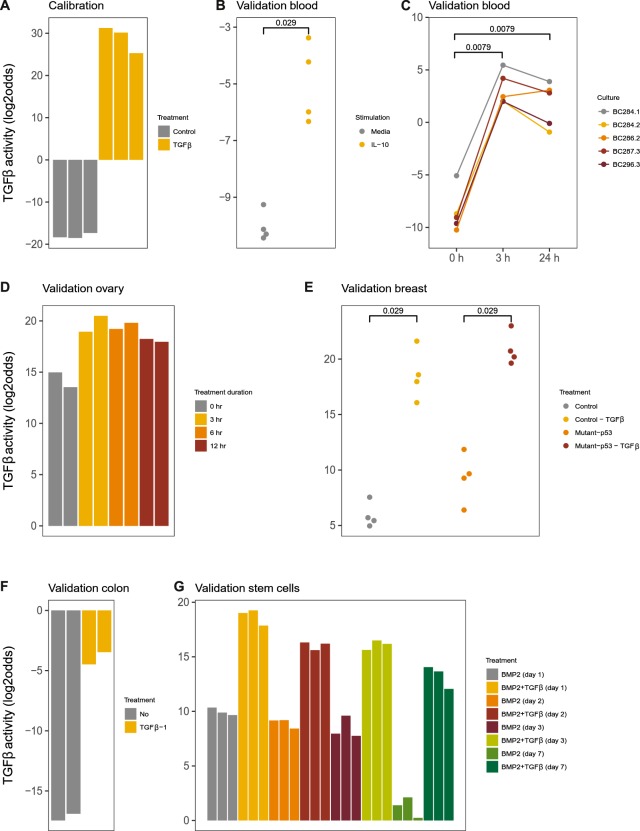
Figure 3.
TGFβ pathway model. (A) Calibration of the TGFβ pathway model on dataset GSE17708 containing A549 lung adenocarcinoma cell line samples stimulated with 5 ng/mL TGFβ1. (B–G) Validation on independent GEO datasets, different cell types. (B) GSE43700, interleukin 10 (IL10) stimulation of peripheral blood mononuclear cells. (C) GSE7568, TGFβ1 (10 ng/ml) stimulation during indicated time periods of primary macrophages differentiated by treatment with dexamethasone; samples from 5 independent donors. (D) GSE6653, immortalized ovarian surface epithelial cells (IOSE) derived from normal ovarian epithelial cells stimulated with TGFβ1 (10 ng/ml) during time periods as indicated. (E) GSE14491, treatment with TGFβ1 (5 ng/ml) of breast cancer cell line MDA-MB-231, transfected with either control (shGFP) or anti-p53 (shp53) short-hairpin RNAs. (F) GSE59771, TGFβ1 treatment of a colon cancer cell line with inducible TGFβ1 R2 (no associated publication). (G) GSE84500, BMP2 treatment of human mesenchymal stem cells for 1, 2, 3 or 7 days in the presence or absence of TGFβ1 (2 ng/ml). The activity score is calculated as log2odds. Two-sided Wilcoxon signed-rank statistical tests were performed; p-values are indicated in the figures.

