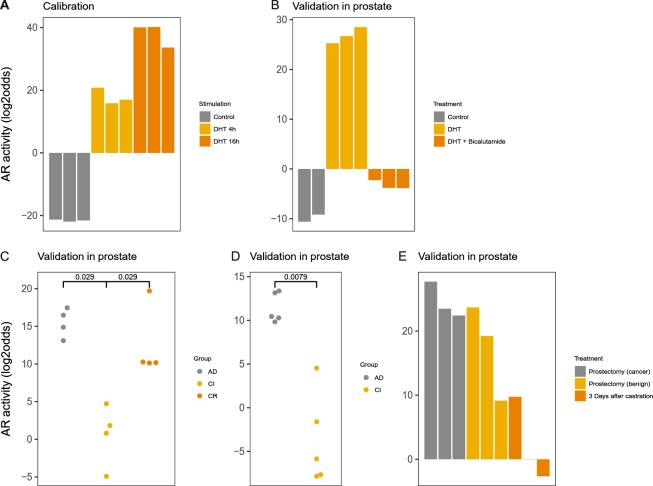
Figure 5.
AR pathway model. (A) Calibration of the AR pathway model on dataset GSE7868, containing samples from LNCaP prostate cancer cells, treated with 100 nM dihydrotestosterone (DHT) for 0, 4 and 16 h. (B–E) Validation on independent GEO datasets. (B) GSE7708, LNCap cells treated with 1 nM DHT with or without bicalutamide (added 2 h before DHT) for 16 h. (C) GSE21887 KUCaP-2 cell grafted in nude mice, androgen-dependent tumour growth (AD), castration-induced tumour regression (CI), and castration-resistant (CR) regrowth. (D) GSE33316, LuCaP35 cells grafted in NOD-SCID mice, AD and CI. (E) GSE32982, biopsy samples from prostate cancer, benign prostate tissue and prostate cancer tissue three days after surgical castration. The activity score is calculated as log2odds; p-values are indicated in the figures.

