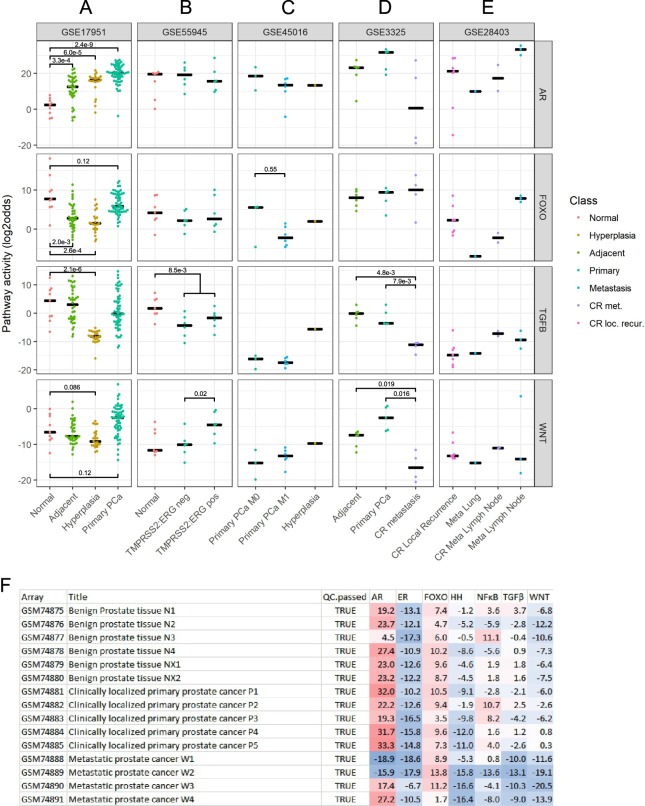
Figure 7.
Primary and metastasized prostate cancer as clinical examples for the combined use of multiple pathway analyses. Shown are for the analysed datasets (listed from left to right) from top to bottom: AR, FOXO-PI3K, TGFβ and Wnt pathway activities (indicated at the right side of the figure). Dot plots show the median of the measured pathway scores. (A) GSE17951, macrodissected tissue samples from normal (healthy) prostate (n = 9), cancer-adjacent prostate (n = 36), hyperplasia (n = 23) and primary prostate cancer (n = 57). (B) GSE55945, macrodissected tissue samples from “normal” (unknown whether healthy or cancer-adjacent) prostate (n = 7) and low-grade primary prostate cancer (Gleason score 6–7), two subtypes characterized by absence (middle, n = 6) and presence (right, n = 6) of the fusion gene TMPRSS2:ERG. Statistics: one-sided Wilcoxon rank-sum test to compare fusion-positive (known Wnt active) and fusion-negative group. (C) GSE45016, microdissected tissue samples from high-grade (Gleason 8–9) primary prostate cancer stage M0 without metastases (n = 3) and M1 with metastasis (n = 6) and hyperplasia (n = 1). (D) GSE3325, macrodissected tissue samples from cancer-adjacent prostate (n = 6), primary cancer (n = 5), and castrate-resistant (CR) metastases (n = 4); Statistics: one-sided Wilcoxon rank-sum test to compare TGFβ pathway activities, known TGFβ loss in PCa. (E) GSE28403, CR local recurrence (n = 7), metastasis lung (n = 1), CR lymph node metastasis (n = 2), metastasis lymph node (n = 3). The activity score is calculated as log2odds. P-values are indicated in the figures. (F) GSE3325, iIlustrative presentation of individual patient samples with multiple pathway scores. From left to right: GSM number indicating sample number; clinical annotation as supplied in GEO, ‘benign’ indicates benign tissue adjacent to cancer; Quality Control (TRUE means: passed QC); individual pathway activity scores indicated as log2odds with colour coding ranging from blue (most inactive) to red (most active). Unless otherwise indicated, two-sided Wilcoxon signed-rank statistical tests were performed; p-values are indicated in the figures.

