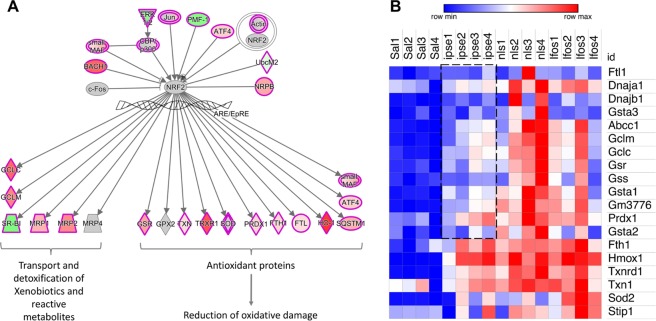
Figure 7.
Oxidative stress responses of the bladder during ifosfamide-induced hemorrhagic cystitis. Pathway and functional analyses were generated through the use of IPA57. (A) Schematic representation of the relationships between NRF2 and antioxidant proteins and proteins involved in heme homeostasis and xenobiotic detoxification. A more detailed version is shown in Supplementary Fig. S6. The keys to the shapes and colors are as detailed in Fig. 4. (B) Heat map showing levels of expression of genes encoding major antioxidant enzymes. Compared to the ifosfamide only group and group pretreated with the NLS mutant of IPSE, there were relative reduction in the expression of Abcc1, Gclc, Gclm, Gsr, Gss, Gsta1, Gsta2, Gm3776 and to some extent Prdx1, Stip1, Sod2, Dnaja1 and Dnajb1. Red designates gene upregulation while blue denotes downregulation. The columns represent data for individual mice in each treatment group without hierarchical clustering (“Sal”: saline vehicle treatment, “ipse”: ifosfamide and IPSE treatment, “nls”: ifosfamide and NLS mutant of IPSE treatment, “Ifos”: ifosfamide treatment only).

