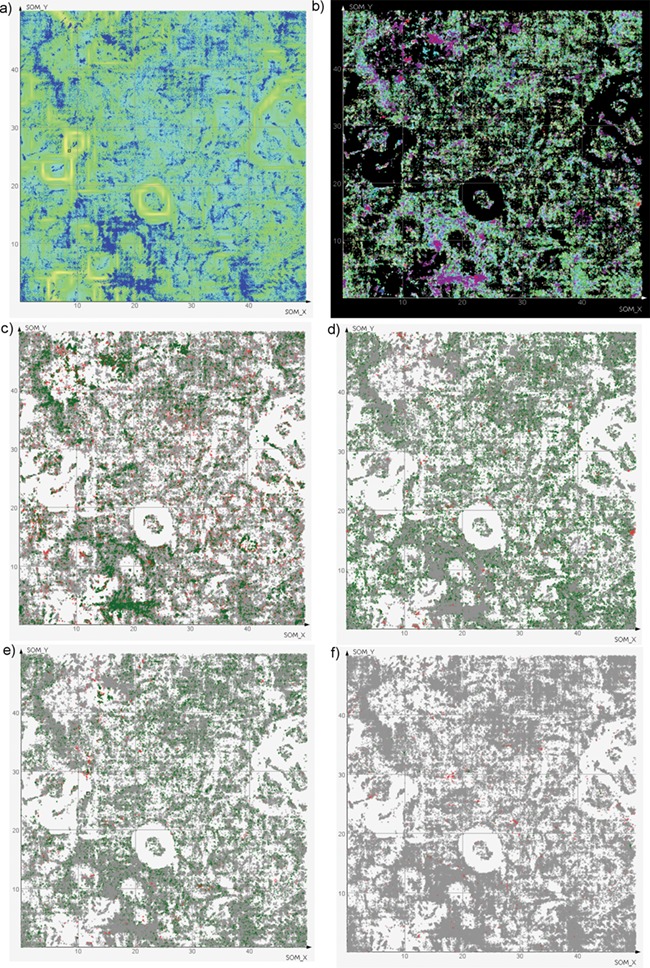
Figure 7.

SOMs of antiviral chemical space. (a) All compounds (blue dots) with background colored according to neuron similarity. Greener areas correspond to high local similarity, yellow borders divide regions. (b) The same compound dots colored by virus family (color legend is available as Supplementary data 16). Note that compounds tested against more than one family (light yellow) are scarce. (c–e) The same dots colored by activity against a certain species: green, active; red, inactive; gray, not tested. (c) HIV-1; (d) Hepatitis C virus; (e) Influenza A virus; (f) Dengue virus.
