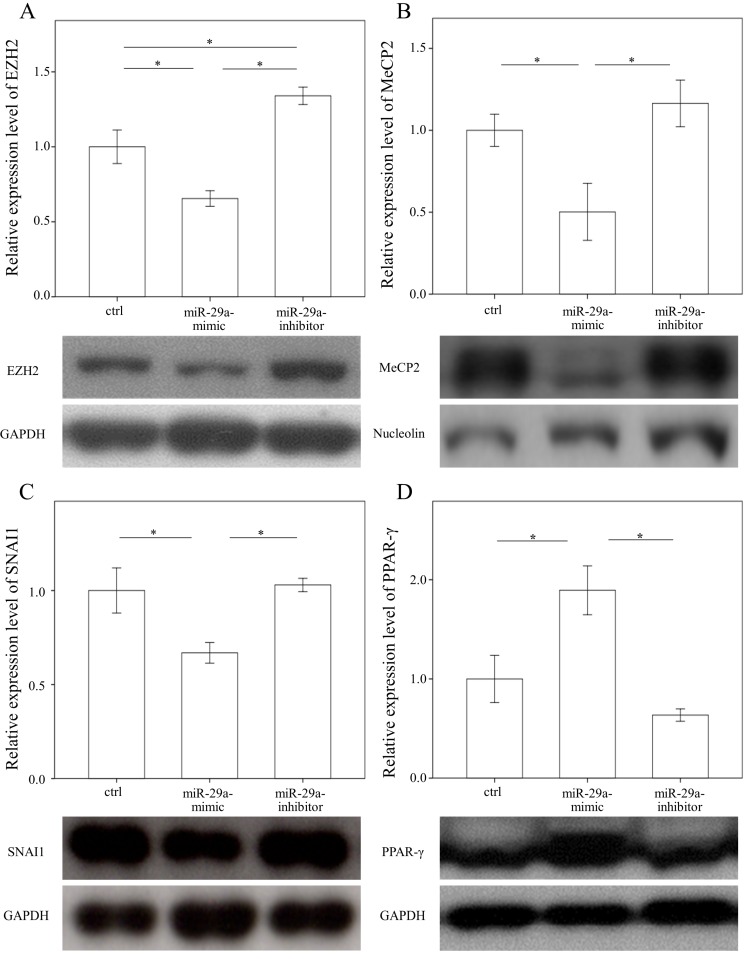
Figure 3.
Comparison of protein expression of EZH2 (A), MeCP2(B), SNAI1(C), and PPAR-γ (D) in primary hepatic stellate cells after being treated with or without a miR-29a mimic or inhibitor or only a miRNA scramble for 24 hours. Data are expressed as mean ± SE of the four to six samples per group. *indicates a p < 0.05 between the groups.

