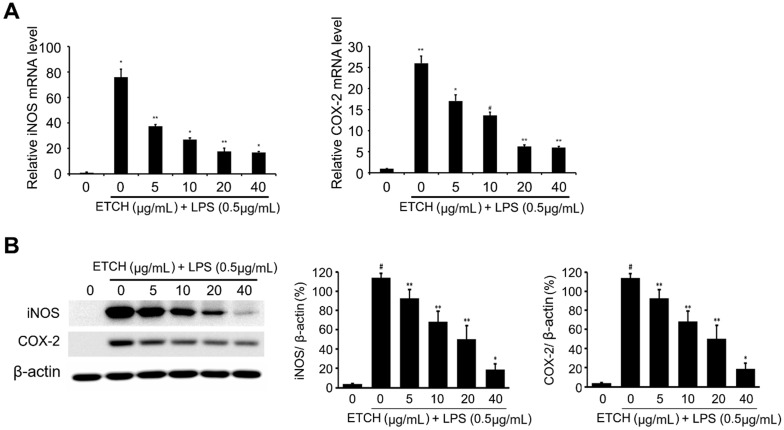
Figure 3.
Effects of ETCH on the expression levels of proinflammatory regulators. The Transcriptional (A) and translational (B) expression levels of iNOS and COX-2 genes in response to ETCH treatment. The data have been normalized using an internal control, GAPDH. Statistical significance was determined by Student's t-test. Results are shown as mean ± SD values of three experiments; *p < 0.05, **p < 0.01, and #p < 0.001.

