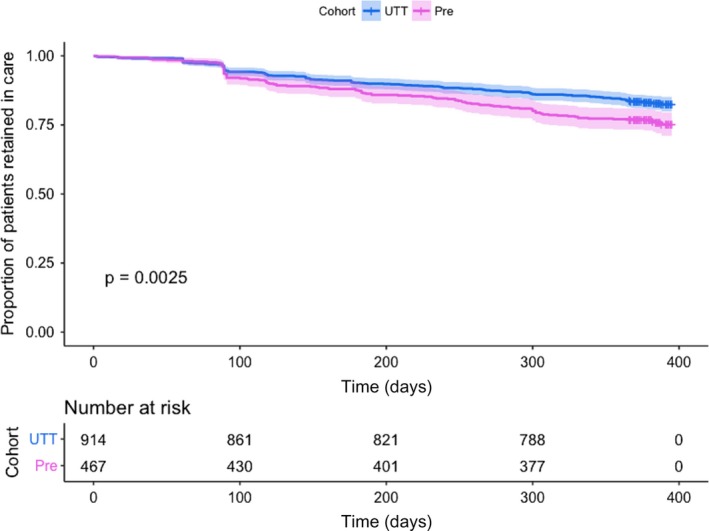
Figure 1. Survival plots based on Kaplan–Meier estimates comparing retention in care in pre‐UTT (pink) versus UTT (blue) cohorts.

Shaded area represents the 95% confidence interval. UTT, Universal Test and Treat.

Shaded area represents the 95% confidence interval. UTT, Universal Test and Treat.