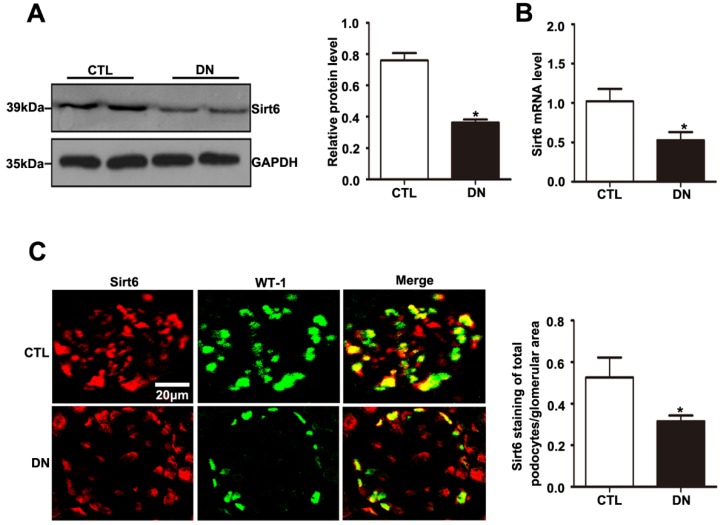
Figure 3.
Sirt6 expression in glomeruli from mice with DN. (A) Representative Western blots of glomerular Sirt6 expression and quantitation in the different groups (n=6). *P< 0.05 relative to control. (B) The mRNA level of glomerular Sirt6 expression in each group (n=6). *P< 0.05 relative to control. (C) Representative images of double immunofluorescent staining of glomerular WT1 and Sirt6 in the different groups (original magnification, ×400) and quantitation of these results (n=6). *P< 0.05 relative to control. CTL=control, DN=diabetic nephropathy.

