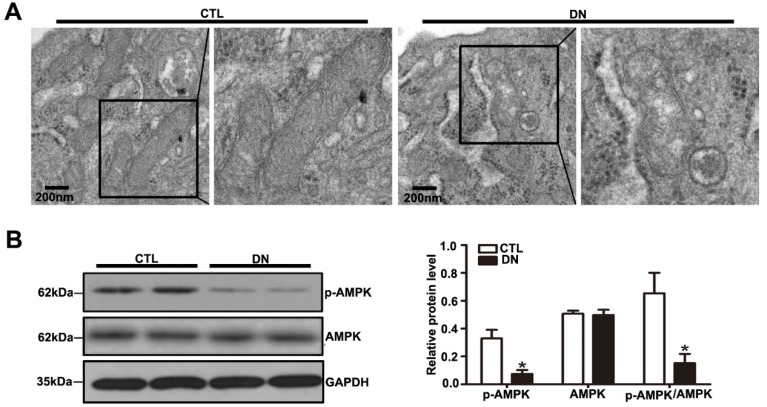
Figure 4.
Effects of HG on podocyte mitochondrial morphology and function of mice with DN. (A) Representative images of the ultrastructure of podocyte mitochondria by transmission electron microscopy in each group (original magnification, ×15 000). (B) Representative Western blots of glomerular p-AMPK and AMPK expression in the different groups and quantitation of these results (n=6). *P< 0.05 relative to control. CTL=control, DN=diabetic nephropathy.

