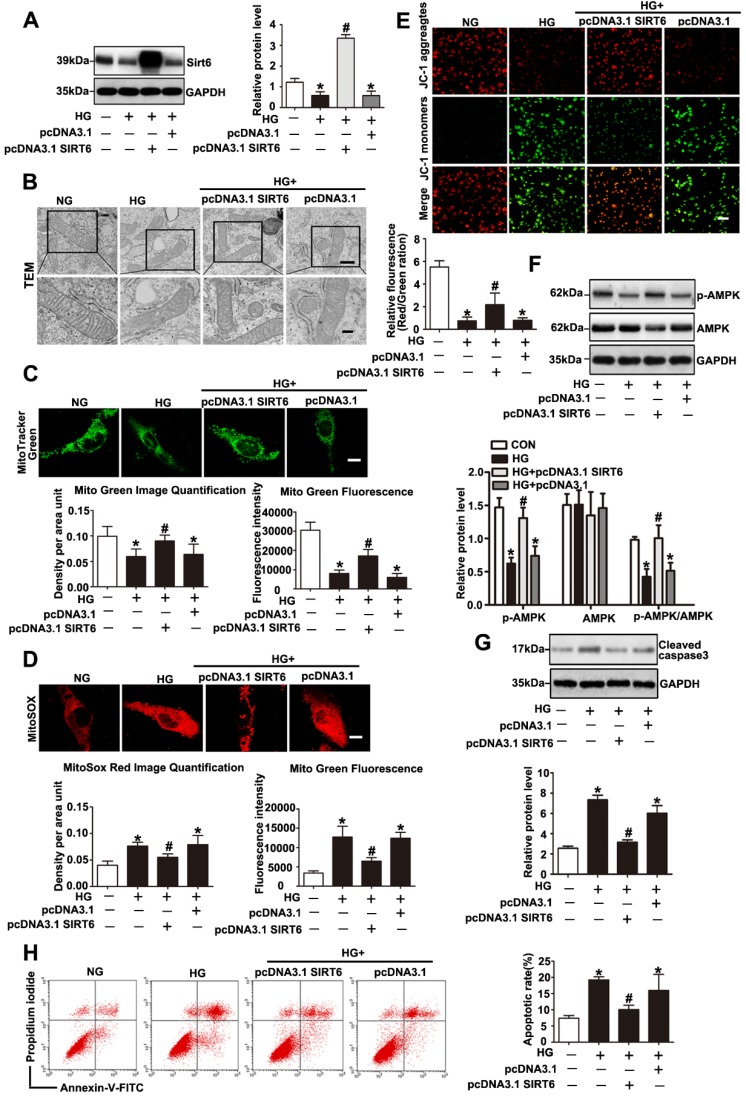
Figure 7.
Sirt6 overexpression attenuated HG induced mitochondrial dysfunction and podocyte injury. Podocytes were transfected with no plasmid, pcDNA3.1, or pcDNA3.1-SIRT6 and then stimulated with HG (30 mM) for 24 h. Untreated and untransfected podocytes were regarded as normal cells. (A) Representative Western blots and quantitative analysis showing the relative protein level of Sirt6 after pcDNA3.1-SIRT6 transfection of podocytes in different groups (n=4). *P< 0.05 compared with normal cells. #P< 0.05 compared with cells treated with HG only. (B) Ultrastructural changes in podocytes by transmission electron microscopy in each group (original magnification, ×8 000, ×15 000). (C) Mitochondrial numbers of podocytes were determined by Mito Green fluorescence staining in different groups (original magnification, ×1 000) and quantitation of these results (n=4). *P< 0.05 compared with normal cells. #P< 0.05 compared with cells treated with HG only. (D) Mitochondrial oxidative stress and ROS production were evaluated by MitoSox Red fluorescence staining in different groups (original magnification, ×1 000) and quantitation of these results (n=4). *P< 0.05 compared with normal cells. #P< 0.05 compared with cells treated with HG only. (E) Representative images of mitochondrial membrane potential of podocytes by JC-1 staining in each group (original magnification, ×100) and quantitation of these results. *P< 0.05 compared with normal cells. #P< 0.05 compared with cells treated with HG only. (F) Western blots detection of AMPK and p-AMPK expression in podocytes for each group and quantitation of these results (n=4). *P< 0.05 compared with normal cells. #P< 0.05 compared with cells treated with HG only. (G) Western blots results of cleaved caspase-3 expression of podocytes in each group and quantitation of these results (n=4). *P< 0.05 compared with normal cells. #P< 0.05 compared with cells treated with HG only. (H) Flow cytometry analysis of apoptosis in the different groups and quantitation of these results (n=4). *P< 0.05 compared with normal cells. #P< 0.05 compared with cells treated with HG only.

