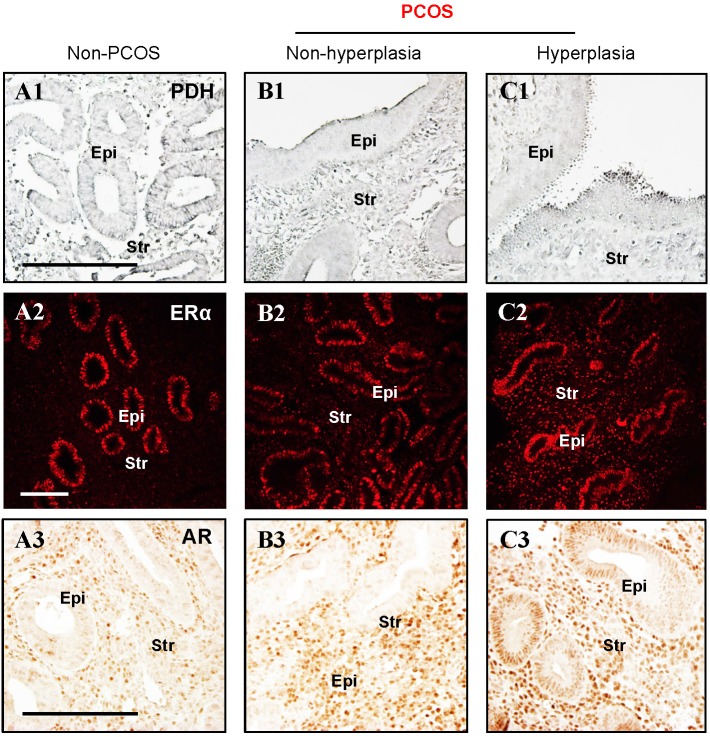
Figure 3.
(A1-C3) Immunohistochemical and immunofluorescent staining of PDH (A1-C1), ERα (A2-C2), and AR (A3-C3) in the endometrial tissue sections from non-PCOS (n = 3) and PCOS patients with non-hyperplasia (n = 3) and hyperplasia (n = 4). The images are representative of those observed in numerous sections from multiple uterine tissues. Epi, epithelial cells; Str, stromal cells. Scale bars (100 μm) are indicated in the photomicrographs.

