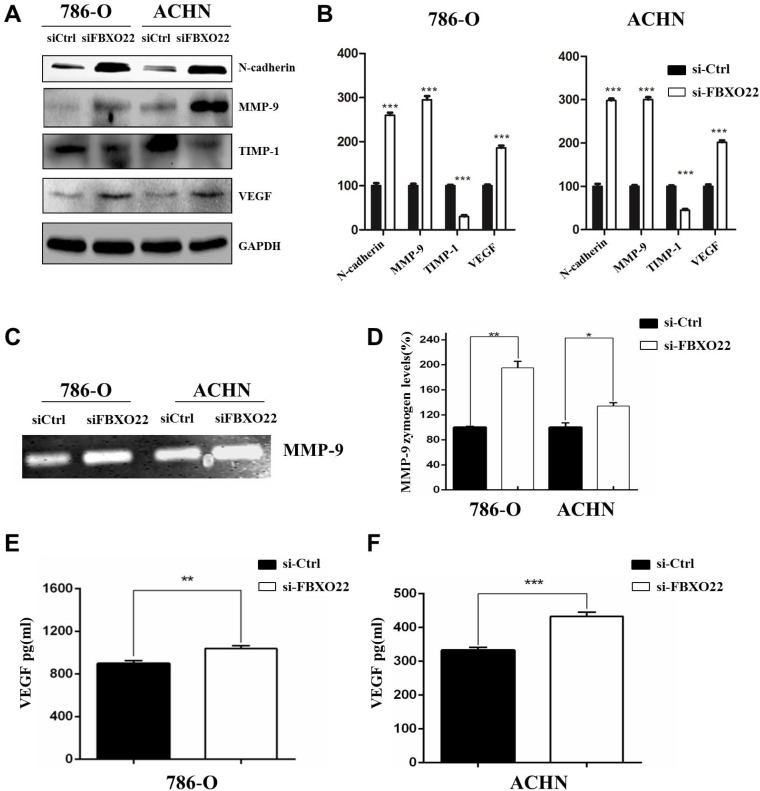
Figure 5.
Target genes regulated by FBXO22. (A, B) Western blot analysis was used to detect the relative protein levels of N-cadherin, MMP‑9, TIMP1 and VEGFA in FBXO22 low expression group and control group for both 786-O and ACHN cell lines. GAPDH was used as a loading control. (C, D) The activity of MMP-9 were evaluated by Gelatin zymography. (E, F) ELISA for the secretion of VEGF in 786-O and ACHN cells Transduced with control siRNA (siCtrl) or small interfering RNAs (siRNAs) targeting FBXO22. Data are presented as the mean ± SD for three independent experiments, *P < 0.05, **P<0.01,***, P < 0.001.

