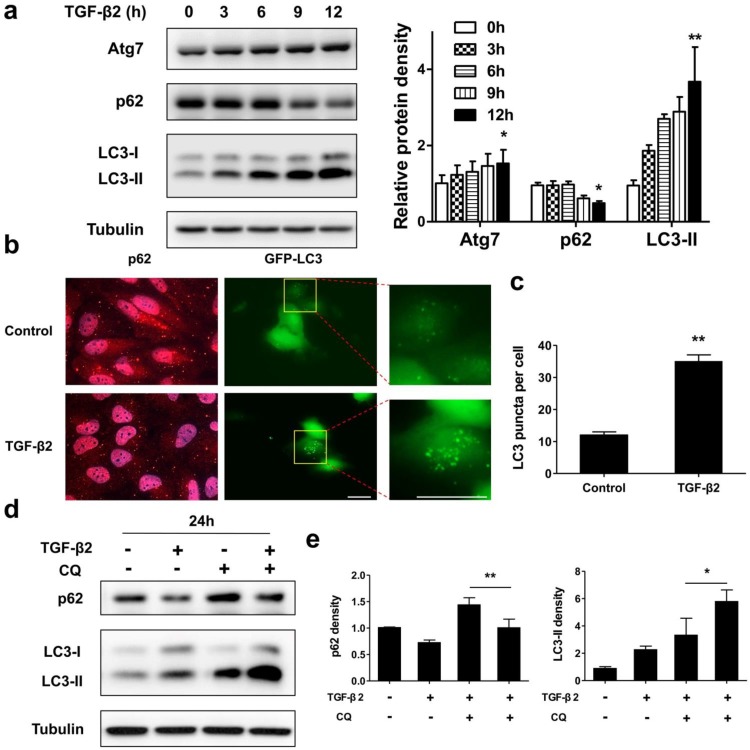
Figure 4.
Autophagy is activated during TGF-β2-induced EMT process in RPE. (a) Immunoblotting analysis of Atg7, p62, and LC3 in ARPE-19 cells treated with TFG-β2 (10 ng/ml) for the indicated hours. Tubulin levels were used as loading control. Quantification of protein expression were shown as the means±S.D. *P<0.05, **P<0.01 vs 0 h. (b) Fluorescence analysis of the localization of p62 or LC3 in ARPE-19 cells expressing either GFP-LC3 (green) or immunofluorescence of p62 (red), respectively, following treatment with TGF-β2 (10 ng/ml) for 24 h. (c) Quantification of the LC3-positive puncta per cell. Data are shown as the means±S.D. n=4, **P<0.01, scale bar, 10 μm. (d) Immunoblotting analysis of p62 and LC3 in ARPE-19 cells treated with TFG-β2 (10 ng/ml; 24 h) either in the presence or absence of the lysosome inhibitor chloroquine (CQ) (30 μM) for the last 12 h of treatment. Tubulin was used for protein loading control. (e) Quantification of the band intensities of p62 and LC3-II obtained by immunoblotting analysis as in panel (d), expressed as the means±S.D. n=3, *P<0.05 **P<0.01.

