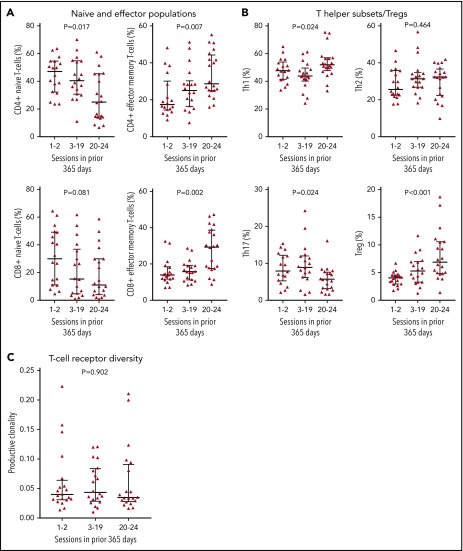
Figure 3.
Detailed lymphocyte phenotyping. (A) Percentages of naive and effector memory T-cell populations among CD4+ T cells or CD8+ T cells based on group. (B) Percentages of Th subsets and Treg cells among CD4+ T cells based on group. (C) T-cell receptor diversity based on group, as measured by productive clonality. Horizontal lines indicate the median and interquartile range. All blood counts in this figure were obtained immediately before plateletpheresis.

