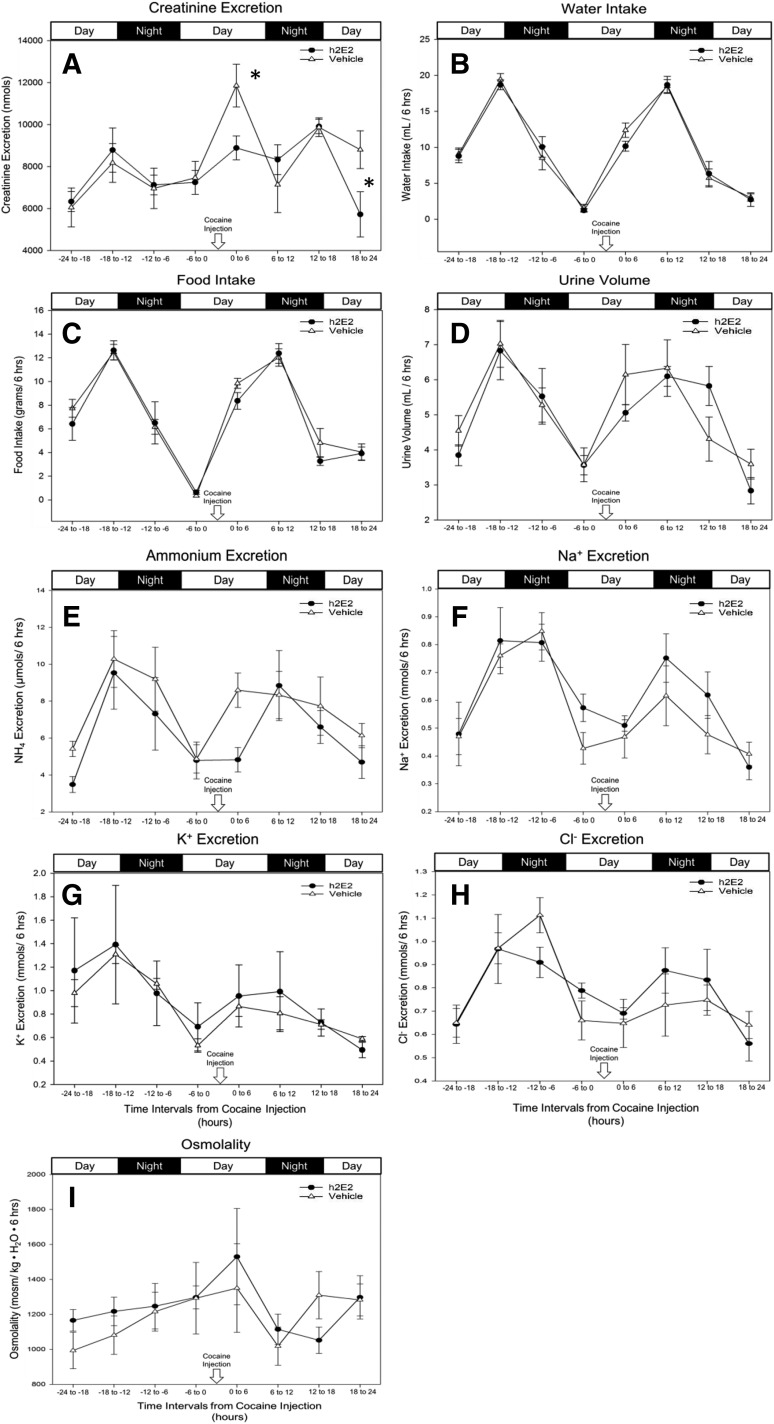
Fig. 2.
Cocaine’s effect on the measures of kidney function. Mean ± S.E.M. values for creatinine excretion (A), water intake (B), food intake (C), urine volume (D), ammonium excretion (E), Na+ excretion (F), K+ excretion (G), Cl− excretion (H), and osmolality (I) in vehicle-treated (open triangles) and h2E2-treated (closed circles) animals are displayed. (A) Creatinine was normalized to urine volume to yield total urine creatinine excretion (in nanomoles) per 6-hour collection interval. (E–H) Excretion levels were normalized to urine volume to yield ion excretion (in millimoles) per 6-hour collection interval (n = 5 to 6 animals, n = 1 for the 18–24 hour collection interval in G only due to limited urine volumes). Asterisks represent statistical significance (P < 0.05) from two-way repeated measures analysis of variance comparing h2E2-treated to vehicle control–treated animals.

