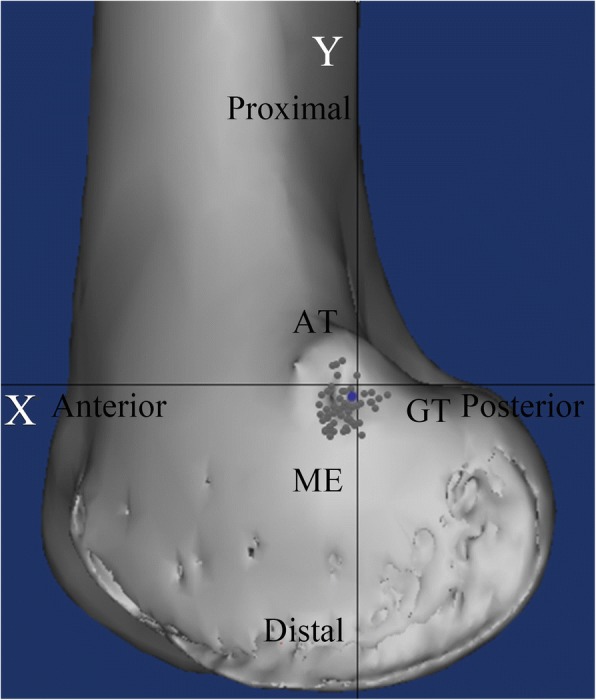
Fig. 7.

A representative computed tomography image showing the distribution of the locations of all the medial patellofemoral ligament femoral tunnels. The blue circle indicates the location of Schöttle point, the black circle indicates the centers of the medial patellofemoral ligament femoral tunnels in all 60 reconstructed knees. AT: adductor tubercle; ME: medial epicondyle; GT: gastrocnemius tubercle
