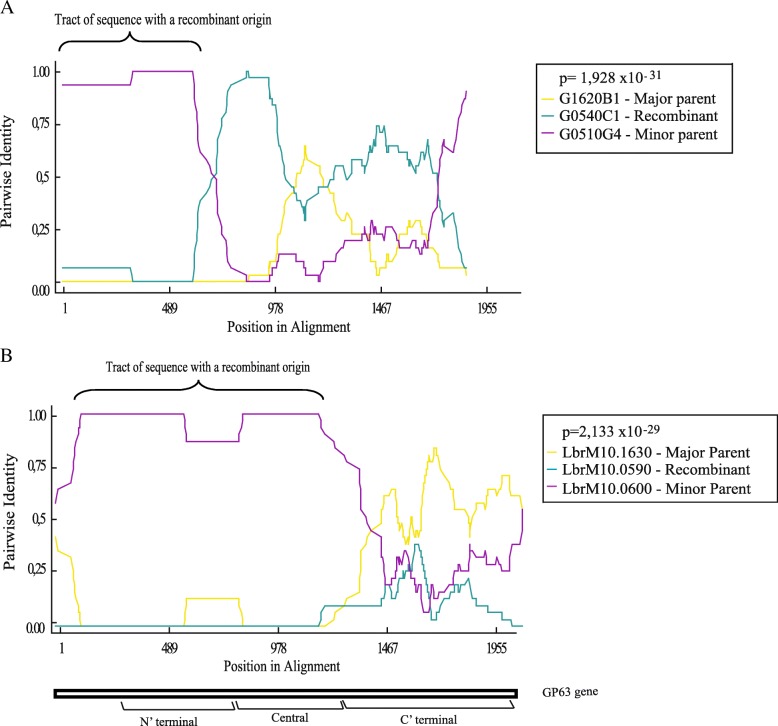
Fig. 6.
Leishmania braziliensis GP63 recombination events. Representative figure indicating recombination events identified using the RDP4 software. The p-values calculated for the recombination events are indicated as well as the parental and recombinant regions of the chosen gene. The graph shows the gene that underwent a recombination event (in blue) and other two genes that most likely were involved in this recombination, named major parent (in yellow) and minor parent (in purple), identified by pairwise alignment. Despite their definition as major or minor parent, any one of these genes may be involved in the recombination. a Predicted recombination event between two PCR genes, G1620B1 and G0510G4, with the recombinant gene (G0540C1) showing a 100% identity in most of the N-terminus region with G0510G4. b Predicted recombination event between two annotated genes, LbrM10.1630 and LbrM10.0600, showing the putative recombinant gene (LbrM10.0590) with an almost 100% pairwise identity in most of its N-terminal and central regions with the gene LbrM10.0600. A representative GP63 gene structure is shown in the bottom of the figure, discriminating N-terminal, Central and C-terminal regions

